The post HR Analytics Maturity Model: Test & Improve Your Level appeared first on AIHR.
]]>A survey by SD Worx found that although 3 in 4 organizations claim to have a high analytics maturity level, 44% of organizations believe they lack the expertise required to deliver staff reports and insights. This demonstrates a mismatch between where businesses believe they are and where they are in reality.
In this article, we’ll explore the HR analytics maturity model, how to conduct an HR analytics maturity assessment to determine your current maturity level, and how to increase HR analytics maturity in your organization based on the business’s unique needs and goals.
Contents
HR analytics maturity model explained
Why HR analytics maturity matters
HR analytics maturity assessment
How to increase HR analytics maturity in your organization

HR analytics maturity model explained
The HR analytics Maturity model defined by Bersin/Deloitte consists of 4 stages:
- Operational reporting
- Advanced reporting
- Advanced analytics
- Predictive analytics.

Let’s explore the four levels in more detail.
Level 1: Operational reporting
At level 1, the HR department works with ‘traditional’ operational reporting, using available data to understand what happened in the past—and potentially why—and what this means for the business. The HR team reports traditional metrics such as headcount, attrition, labor cost, and training cost, usually generated using a Human Resources Information System (HRIS).
Level 2: Advanced reporting
HR departments at level 2 are capable of operational and advanced reporting of HR metrics. This proactive reporting provides frequent, multiple perspectives and is sufficiently advanced to influence strategic decision-making. HR reporting is descriptive and focused on efficiency. Most organizations at level 2 deliver HR metrics to managers and executives in organized dashboards.
Level 3: Advanced analytics
At level 3 of the data and analytics maturity model, the organization has surpassed operational and proactive reporting and has succeeded in introducing more thorough, advanced analytics. Statistical modeling is used to solve business problems and predict the future.
Level 4: Predictive analytics
At level 4 – the highest level of analytics maturity – the HR team plays a major role in the organization’s strategic decision-making. It’s gathering data, using it to predict what could happen in the future, and to plan for it. HR is aware of the impact of people policies, actively uses predictive models, and is capable of playing a fully strategic role within the company.
Organizations that have reached level 4 in the people analytics maturity model are, therefore, more likely to have a Chief Human Resources Officer (CHRO) on their Board of Directors or a people analytics center of excellence that directly reports to the CEO.
HR analytics maturity tends to mirror the broader HR function’s maturity, but can lag behind or advance ahead depending on the organization’s focus and investment. For example, early-stage HR functions tend to be in the reporting stage, where metrics like headcount and turnover are tracked, while more advanced HR functions move into predictive analytics.
That said, the two don’t always progress in sync. A company might have a relatively mature HR function with consistent processes, strong leadership support, and strategic alignment, but still rely on spreadsheets for tracking data. In this case, HR is ready to use insights but lacks the tools or skills to move beyond descriptive metrics.
Sometimes, an organization has strong data capabilities (e.g., a central analytics team or investments in BI tools), but the HR function itself isn’t fully developed—processes are inconsistent, or decision-making is still mostly reactive. The analytics may be capable of producing predictive models, but without a solid HR foundation, the data inputs are unreliable, or the insights aren’t used.
In short, the development of one often influences the other, but mismatches do happen. Companies get the most value when HR practices and analytics capabilities evolve together.
Why HR analytics maturity matters
Understanding where your organization sits on the HR analytics maturity curve can have a positive impact on all areas of the business.
- Enhancing employee experience: A data-driven approach and advanced HR analytics can help you spot engagement trends and predict turnover risks, which enables HR teams to take proactive measures to improve the employee experience and retain top talent.
- Driving business performance: When workforce strategies align with the business’s long-term goals, it helps ensure the right people are in the right roles at the right time. This facilitates more efficient operations, which saves the organization money and drives revenue.
- Improving risk management: Through analyzing workforce trends, organizations are able to predict future skill and talent gaps and tackle issues before they escalate. With a mature analytics function, organizations can minimize risk and maintain a strong workforce.
- Fostering a data-driven culture: As organizations progress through the stages of the HR analytics maturity model, data and analytics become a core part of daily operations and decision-making. This drives innovation, gives companies a competitive edge, and cements HR as a strategic business partner that facilitates organizational growth.
Reaching the next level of HR analytics maturity takes an HR team that works confidently with data, turns insights into strategic actions, and supports evidence-based decisions across the business.
With AIHR for Business, you can upskill your HR team in data literacy, reporting, dashboarding, and using analytics tools, building the capabilities needed to operate as a high-impact, data-driven HR function.
HR analytics maturity assessment
It’s essential to know where you are today to achieve the next stage of maturity. The HR analytics maturity self-assessment (pictured below) can help you identify the current maturity level of your organization.

For each statement, decide whether you strongly disagree, disagree, agree, or strongly agree.
Each answer gives you the following points:
- Strongly disagree: 0 points
- Disagree: 1 point
- Agree: 2 points
- Strongly agree: 3 points
Once you’ve completed your answers to all the statements, add your points. Your total provides an estimation of your organization’s analytics maturity level.
- 0-5 points: Level 1 – Operational reporting
- 6-11 points: Level 2 – Advanced reporting
- 12-18 points: Level 3 – Advanced analytics
- 19+ points: Level 4 – Predictive analytics.
Go on to read how to progress from your level to the next below.
Extra tips for conducting an HR analytics maturity assessment
- Review current analytics output: Look at the reports and dashboards you’re already producing. Are they mostly descriptive (e.g., headcount, turnover rates), or are you starting to forecast trends and model outcomes? The type and depth of your output say a lot about your current maturity level.
- Gather stakeholder feedback: Talk to HR team members, business leaders, and department managers. Ask how they use HR data, what’s missing, and whether current insights help them make decisions. Their input can reveal blind spots and opportunities.
- Bring in external help: Consultants, analytics trainers, or software vendors can help you benchmark against best practices, uncover gaps, and recommend next steps. This is especially useful if you’re stuck or not sure how to progress to the next stage.
How to increase HR analytics maturity in your organization
Let’s explore how you can progress from one stage of the HR analytics maturity model to the next.
Getting to Level 1: How to establish operational reporting
This is for businesses just starting their analytics journey who want to establish a strong level 1 foundation. The HR department should focus on using historical data to pinpoint the changes that have occurred in the organization. An HRIS can help you keep accurate and consistent employee records and maintain reliable and consistent data. Make sure to standardize fields and naming conventions across systems (e.g., job titles, departments, employment types) so reports are accurate and easy to interpret.
In a small team, you may want to appoint one person in the HR team to be the “data person”, ideally someone with some data literacy who is comfortable with spreadsheets, simple dashboards, or HRIS reporting tools.
Start producing a small set of core reports that give you a clear picture of your workforce. A few useful starting points:
- Headcount report
- Total headcount by department and seniority level
- Breakdown by employment type (e.g., full-time, part-time, contract).
- Turnover report
- Monthly or quarterly exits with reasons by department
- Voluntary vs. involuntary turnover.
- New hire report
- Number of hires per month
- Source of hire, time-to-fill, and new hire attrition (if available).
- Absence report
- Average days lost per employee, by reason (e.g., sick leave, parental leave)
- Patterns across teams or time periods.
Even at this early stage, try to automate recurring reports through your HRIS or spreadsheet templates. That way, you’re not starting from scratch every time, and it’s easier to spot trends.
From Level 1 to Level 2: How to move from operational to advanced reporting
To move beyond basic reporting, the HR team needs to shift from simply tracking what happened to exploring why it happened and how that information can support smarter decisions.
To move from level 1 to level 2, the HR department should proactively create relevant reports around business questions. Don’t just list numbers—analyze trends. For example, is turnover higher in specific departments? Are certain roles taking longer to fill?
Start comparing your data to internal goals or external standards to give your numbers context. Knowing that your turnover rate is 18% is helpful, but knowing that your industry average is 12% tells a clearer story. Also, adding layers to your metrics helps provide more information. Break down data by variables like department, tenure, or seniority. This helps spot patterns you’d miss in high-level totals.
Instead of sending static reports, build visual dashboards that managers and executives can review at a glance. Focus on clarity and relevance, and include only the metrics that support decision-making.
At this level, you may have one or more HR analysts and centralized reporting processes. The goal is to move from describing the past to explaining it, helping leaders take more informed action.
From Level 2 to Level 3: How to move from advanced reporting to advanced analytics
The move from level 2 to level 3 primarily involves using statistical analysis for HR data, such as demographics, performance, and hiring data, combined with financial and operational data from different systems. This enables you to uncover patterns, predict outcomes, and support deeper business questions.
At this stage, it’s important to have a centralized HR (analytics) department and at least some level of data integration of the various systems. Organizations typically use a business intelligence (BI) system to compile data from multiple systems or to build a database or a data warehouse of relevant data that can easily be used for analysis. Statistical tools (e.g., R, Python, or analytics features in platforms like Power BI or Tableau) enable deeper insights, like regression models, clustering, or forecasting.
After collating the necessary data, you can start answering questions through statistical analysis. To ensure strategic impact, focus on key business issues and translate all results into actionable solutions. At this level, the focus is on explaining what’s happening—not just observing it—so the team can identify root causes and guide smarter decisions.
For example, rather than simply noting high turnover in one department, you might analyze historical data to find that mid-level engineers with no promotion in 18+ months and a recent manager change are more likely to resign. These findings allow HR to take informed action, like launching targeted development or retention programs, based on real evidence, not assumptions.
HR tip
While it may be tempting to skip a step on the HR analytics maturity model, or move quickly from one stage to the next, there’s a risk you’ll invest a lot of resources in building something that may need to be redone at a later stage.
From Level 3 to Level 4: How to move from advanced to predictive analytics
The move from level 3 to level 4—the final stage in the HR analytics maturity model—requires a transition to predictive analytics, which enables organizations to forecast future outcomes and model the impact of different decisions. This allows organizations to mitigate risks more effectively and thus engage in strategic workforce planning. Put simply, the goal is to support proactive, forward-looking strategies like workforce planning, succession management, and risk mitigation.
For example, predictive HR analytics can help you:
- Forecast turnover rates over the next 12 months and identify roles or departments most at risk
- Predict internal mobility trends and identify employees who are likely to be ready for promotion
- Anticipate hiring needs based on business growth plans, past attrition patterns, and skill gaps.
To get to this level, you will need additional analytical capabilities in your team, for example, a dedicated data scientist sifting through your people data. As predictive modeling goes beyond simple data analysis, you will begin to use tools that require more programming knowledge. An example of this is R, an open-source system for statistical computation and visualization.
At this stage, HR becomes a true strategic partner by helping the business plan for what’s ahead, not just react to what’s already happened.
Over to you
Understanding the four stages of the HR analytics maturity model and where your organization currently sits can help you better utilize data and analytics to drive performance and success.
Climbing the levels of the model should not be a general goal but rather a tool to serve your business’s needs. If you’re considering investing in greater analytics maturity in your organization, it’s important to map out your needs, demonstrate the value that greater data maturity could yield, and weigh these against the costs.
The post HR Analytics Maturity Model: Test & Improve Your Level appeared first on AIHR.
]]>The post 25 HR Data Sources for Analytics appeared first on AIHR.
]]>This article lists common HR data sources you can use as a starting point for your people analytics efforts, and also provides somes suggestions on how to work with data sources in HR.
Contents
Types of HR data sources
HR systems data sources
Other HR data sources
Business data sources
External data sources
7 tips for working with HR data sources
FAQ
Types of HR data sources
HR data sources can be categorized into four main groups:
- HR systems data: Data from the company’s Human Resources Information System (HRIS) includes most of the company’s data about its employees. Common examples of HRIS providers, especially at large companies, include Oracle, SAP, and Workday. Other systems include the applicant tracking system (ATS) and learning management system (LMS).
- Other HR data: Some HR data is essential for data-driven decision-making but is not included in the HRIS. This is often data acquired through surveys or other measurement techniques.
- Business data: Although it is impossible to cover all business data when doing people analytics, it plays an increasingly important role in connecting workforce trends to broader company outcomes. This includes data from finance, sales, operations, and customer feedback systems.
- External data: Data from external sources, such as industry reports and trends and even data on the flu and the weather, also inform HR strategies.
HR systems data sources
The company’s HRIS contains data on the most common HR functions, including recruitment, performance management, and talent management. Although the modules in the HRIS differ from company to company, there is often a common group of modules that contain data useful for people analytics.
Recruiting data
Recruiting data gathered from the ATS, which is part of or connected to the HRIS, is a common data source for analysis. It includes the number of candidates who applied, their CVs, other characteristics, and data about the recruitment funnel, recruitment sources, selection, and so on. The ATS is the most common source of input for recruiting metrics.
Demographic data
Another key data source is the employee records in the HRIS. These include employees’ IDs, names, genders, dates of birth, residences, positions, departments, cost center specifications, termination dates, and so on. These demographic data are often included in an analysis as control variables.
Also, when data is combined manually, this often provides a database enriched with data from other systems by matching an employee’s ID as a unique identifier.
Absence data
Recorded absence data is another key source of HR data. Managers or HR usually track sick days and record them in a system. Some organizations also record absence reasons. Similarly, other types of leave, like parental and FMLA leave, and tardiness data are also captured.
Performance management data
The performance management system (PMS) is often part of the HRIS and contains information about performance management, including employee reviews and performance ratings.
Learning management data
The learning management system (LMS) is another source of HR information. It contains a course offering and registers employees’ progress through different programs.
However, not all learning data is stored in the LMS. For example, the finance department often holds information on expenditures from external sources, while learning impact and effectiveness are typically measured using surveys. We’ll discuss this further below.

Job architecture
Job architecture is a framework that serves as a foundation for compensation. Other related terms are job grading and job leveling. Different roles are organized into salary scales with bands and grades with maximum reward levels.
For example, a company might group software engineers into levels from Junior to Senior to Lead, each tied to a salary band and clear expectations.
When used in analytics, it helps answer questions like:
- Are pay levels consistent across similar roles or departments?
- How many employees are in roles with growth potential vs. capped roles?
- Are certain levels seeing higher turnover or promotion rates?
- How well is the organization developing talent across job grades?
Compensation & benefits
An essential part of keeping employees engaged is making sure they receive fair compensation for their work. Compensation and benefits data is also stored in the company’s HR system and/or the payroll system. It includes compensation package details and secondary employee benefits.
Succession planning
Succession plans are also often found in the HR system. The amount of data regarding this depends on the organization’s succession planning practices. Example data includes leadership development data and data about which employees are next in line for certain positions.
Talent development
This includes data on programs aimed at growing internal talent—like leadership development tracks, high-potential employee lists, or mentorship participation. While some elements may live in the LMS, broader talent development data often comes from multiple sources, including the HRIS, talent reviews, and program tracking tools. It provides insight into how the organization invests in future leaders and internal mobility.
Exit interviews
Depending on the organization, exit interview data may also be stored in the HRIS. The data provides information on, among other things, why employees left the organization. It can be valuable for gaining insights into reducing employee turnover and improving employee experience.
From your HRIS and ATS to engagement surveys, HR teams sit on a goldmine of data. But to truly unlock its power, you need the skills to analyze, interpret, and act on that data.
With AIHR’s People Analytics Certificate Program, you’ll learn how to collect and clean data from different sources, use data visualization tools for effective storytelling, and turn insights into action.
Other HR data sources
These are sources that typically fall outside the HRIS, often because they’re harder to collect through standardized processes. While not always structured or centralized, this type of data adds important context to how employees work, collaborate, and engage with the organization.
Learning programs data
Data on learning effectiveness and learning program evaluation is often stored separately from the LMS and managed by the learning department. This data may live in Excel spreadsheets and survey collection tools.
Integrating this data into a broader HR reporting and insights database is an early priority for organizations that are starting to work on learning analytics or trying to advance their reporting.
Travel data
Travel data provides useful context about employee roles and work patterns, especially for global or client-facing teams. Since it’s typically managed through finance or travel booking systems, it usually sits outside the HRIS and needs to be pulled in separately for analysis.
Mentoring data
Mentoring programs can be a rich data source when tracked properly. Information such as who participates, how long mentorships last, match types (peer, cross-functional, senior-junior), and feedback from participants can help HR assess program reach, effectiveness, and its role in career growth.
This data is useful for understanding development trends, supporting DEIB goals, and identifying future leaders. It may come from dedicated mentoring platforms, program coordinators, or survey tools.
Employee survey data
A large part of HR data is collected through surveys. This can range from a poll on the quality of food in the cafeteria, a survey by the CEO about their popularity, to the traditional employee engagement survey.
Most companies send out surveys in a decentralized way, which can lead to scattered survey data throughout the organization and survey fatigue. Collecting all this data in one place helps provide better insight into employee survey data.
Engagement surveys
The engagement survey is sometimes part of the employee survey data bank we mentioned. However, engagement surveys are often collected by a third party to guarantee anonymity. This means engagement surveys function as a separate data source with their own structure and reporting.
Wellbeing and wellness
Depending on the organization, records may be available around (participation in) employee wellness programs. This is another data source that is not typically captured in the HRIS.
Organizational social network data
Data on organizational social networks—also referred to as organizational network analysis (ONA)—look at how employees connect and collaborate across the organization. It can reveal informal influencers, communication bottlenecks, and cross-team dynamics.
Data for ONA can come from various sources, including collaboration tools (like email or chat platforms), calendar data, phone logs, or dedicated network surveys. While it requires careful handling due to privacy concerns, ONA can provide valuable insight into how work really gets done beyond org charts.
Business data sources
The scope of business data is almost endless. Many business data sources can be used for people analytics. Here are some of the most important ones.
CRM data
The company’s Customer Relationship Management system holds a wealth of data on customers. This includes customer contact moments, NPS scores for those touchpoints, lead scoring, etc. This data can be crucial outcome data used to measure the impact of people policies on customer-facing employees.
Financial data
Financial data is another key business data source. It can be used for simple analyses of L&D spending or more complicated analyses of labor costs, ROI calculations for different interventions, and other financial analyses.
Production management data
Production management systems track operational metrics like scheduling, service calls, delivery rates, and turnaround times. While primarily used by operations teams, this data can serve as outcome data in people analytics—helping HR assess how workforce policies affect productivity, efficiency, or service quality in production and delivery roles.
Sales data
Sales data is another outcome measurement. Examples include sales per store, which can be used as outcome data to measure the impact of different HR policies, like learning program effectiveness.
External data sources
In addition to internal systems, external data can play a key role in shaping people strategies and understanding workforce dynamics. Here are a few notable categories:
Job market and salary benchmarking databases
Sources like Glassdoor, Payscale, and the Bureau of Labor Statistics (BLS) provide compensation and labor market data. These benchmarks help HR stay competitive in pay, understand talent availability, and spot shifts in demand for certain skills.
Competitor and industry reports
Research from organizations like McKinsey, SHRM, and Deloitte offers insights into hiring trends, workforce benchmarks, and evolving HR practices. These reports help contextualize internal data and guide strategic planning.
Government and compliance databases
Agencies such as the EEOC, OSHA, and IRS publish data on employment law, safety, benefits, and workforce trends. This information supports compliance efforts and can inform risk management and policy development.
Job boards and recruiting platforms
Job boards and recruiting platforms like LinkedIn, Indeed, and ZipRecruiter can serve as external data sources by offering insights into job posting performance, candidate availability, and market competitiveness. Employers using these tools can access analytics to refine sourcing strategies and adapt to labor market trends. Even without full access, these platforms can still provide useful signals about hiring demand and industry standards.
7 tips for working with HR data sources
Working with a multitude of different HR data sources requires structure and effective HR data management. Here are seven best practices to consider implementing:
- Centralize data: Use a Human Resources Information System (HRIS) as a single source of truth for employee data. Integrate other HR systems, such as your ATS, LMS, payroll, and performance management systems, to eliminate data silos. Use HR analytics platforms or data warehouses to consolidate information from multiple sources.
- Maintain compliance and data security: Follow guidelines and regulations to protect employee privacy and maintain HR compliance. Restrict access to sensitive HR data based on role-based permissions and encrypt and back up HR data.
- Train HR professionals on data literacy: Data-literate HR practitioners can deduce relevant information from the data, think critically about what the data shows, and apply it suitably for specific purposes.
- Combine HR data with business data: You can combine HR data with business data (e.g., sales and customer service metrics) to assess how your HR practices contribute to your organization’s business goals. The HR value chain can help you with this analysis.
- Establish clear data ownership and governance: Assign HR data stewards to oversee data integrity and compliance, define data ownership for each HR function (e.g., the payroll team manages salary data, the recruitment team handles ATS data, etc.), and create HR data governance policies covering data access, modification rights, and reporting structures.
- Continuously improve data strategies: Review your HR data collection methods regularly to eliminate redundant data sources and optimize your processes.
- Ensure data quality: You want to make sure the data you collect and work with is accurate, meaning complete, free from errors, and up to date.
On a final note
The short answer to the question of which data sources can be used for data analytics in HR is that there are many different data sources.
The slightly longer answer is that every organization has structured its HR and business data differently. Some of the data and sources mentioned in this article may be available, but other data may not (yet) be. That’s why it’s important to map out what’s already accessible, identify gaps, and build a plan to gradually bring more data into your HR analytics efforts.
FAQ
Common HR data sources for HR analytics are HR systems data, other HR data like employee surveys, business data, and external data.
External data sources of HR data include job market and salary benchmarking databases, competitor and industry reports, government and compliance databases, and job boards.
Typical internal sources of HR data include the HRIS, the ATS, the LMS, and data collected from employee surveys.
The post 25 HR Data Sources for Analytics appeared first on AIHR.
]]>The post HR Canvas: A Practical Guide + Template for HR Leaders appeared first on AIHR.
]]>This article examines the HR business model canvas and why you should use it. We discuss the framework’s key components, how to fill in the canvas, and a practical example. We also provide a downloadable and editable HR canvas template. Let’s go!
Contents
What is the HR canvas?
Why should you use the HR canvas in your HR department?
Key components of the HR canvas
How to use the HR canvas in practice: An example
Best practices for using HR canvas
HR canvas template
What is the HR canvas?
The HR canvas – or, in full, the HR Service Delivery Model Canvas – is a strategic HR management tool designed to solve the problem of many businesses not seeing the alignment of HR solutions to their key business challenges.

Developed by AIHR’s Erik van Vulpen and Dr. Dieter Veldsman, it is inspired by the Business Model Canvas, a management tool widely used by startup founders and executive boards alike. It helps summarize all critical areas of business in a comprehensive yet clear one-pager.

Similarly, the HR canvas provides a clear strategic overview of the HR organization, its customers, value proposition, activities, strategic differentiators, and cost drivers. Clarifying these elements will help HR professionals define their service delivery while articulating HR’s strategic impact and value. In other words, the HR canvas allows HR to align with the business through a common language. HR practitioners can also use the tool to improve internal HR alignment and maintain focus.
The HR canvas helps answer questions such as ‘How should we organize ourselves?’, ‘What (business) problems are we trying to solve?’ and ‘What value are we delivering?’ Discussing these questions using a structured framework helps create the internal alignment required for successful HR service delivery.
Why should you use the HR canvas in your HR department?
One of HR’s biggest challenges today is its lack of strategic impact. Often referred to as not having a ‘seat at the table,’ HR struggles to lead strategic people conversations and show its added value to the business.
As mentioned above, the problem here is not that the business doesn’t want HR to be a strategic player. Rather, the company does not see the alignment of the HR solutions to its key challenges. Using the HR canvas can help solve this problem.
Key reasons for HR to use this tool include:
- Driving strategic contribution: The HR canvas can help HR move beyond administration by clearly linking people initiatives to business challenges and goals, making HR a true strategic partner.
- Providing a clear blueprint for HR operations: As discussed earlier, the canvas maps out HR operations, ensuring a strong focus on strategic priorities.
- Creates a shared framework for your HR team: The HR canvas model aligns HR teams for better collaboration and consistency.
- Helps demonstrate impact: We mentioned this already, but using the HR canvas demonstrates HR’s value and impact on the organization’s leadership.

Key components of the HR canvas
The HR canvas consists of nine distinct fields. There is a sequential order in which the fields should be filled in:

For each component, you can ask yourself a couple of questions that will help you fill in the field. We’ll go over all nine fields in order of completion.
1. Core customer segments
Main question: Who are your core customer groups?
This refers to all relevant stakeholder groups in and outside the organization for which HR is (or should be) creating value. It includes:
- Employees
- Managers
- Customers
- Shareholders
- Employee representation groups
- Etc.
The aim here is to create value for external stakeholders (e.g., customers and shareholders) while also creating value for internal stakeholders (e.g., employees, line managers, and so on).
Additional questions to answer here are:
- Who are we creating value for?
- Who are our most important external customers?
- Who are our most important internal customers?
2. HR value proposition
Main question: What value do you provide for your customers?
For each customer segment, you have a specific value proposition. These are the bundles of HR practices that create value for these customers.
Questions to answer here include:
- What do our Customer Segments expect from us as a function?
- What is HR’s key contribution to each Customer Segment?
- What customer problems are we helping to solve?
- What needs of our customers are we meeting?
- What sets of products and services are we offering for each Customer Segment?
3. HR operating model
Main question: How are your services delivered to your customer segments?
This is about how you create value and deliver the value proposition to your customers.
Questions to answer here are:
- How do we shape the HR operating model?
- How are we reaching and servicing our customer segments?
- How do we collaborate?
- How do we ensure both operational excellence and strategic added value?
- Do we have HR service evaluation processes in place?
4. Customer relationships
Main question: How do you manage your customers and continuously add value?
This focuses on managing customer relationships and helps to determine whether the HR department is investing in the right relationships and managing them adequately.
Questions to answer here include:
- What type of relationship does each of our Customer Segments expect us to establish and maintain with them?
- Are we maintaining the right relationships?
- Are we continuously providing additional value?
5. HR value drivers
Main question: What strategic value does HR drive for the business?
This is arguably the most challenging part of the HR Canvas to complete, as it is often one of HR’s weak spots. Don’t just list your HR activities; ask line managers and senior executives how HR contributes to the organization’s competitive advantage.
Here some of the questions to answer are:
- What are the HR activities for which the business would pay a premium?
- How does HR drive value for the business?
- How do we build unique capabilities and contribute to strategic advantage?
- What value does the business most appreciate?
- Which strategic capabilities are we delivering to help the business win in the marketplace?
Equip your HR team to drive business impact
A well-structured HR canvas provides clarity on HR’s role in achieving business goals. But without the right expertise, even the best HR frameworks can fall short. HR professionals need the right skills to bring them to life.
AIHR for Teams helps equip your team with skills to apply, refine, and execute HR strategies effectively and turn HR plans into measurable business results.
6. Key activities
Main question: What activities do we need to execute to deliver on our value proposition?
This list focuses on the core activities of HR required to realize the value proposition and value drivers.
Consider the following questions here:
- What activities does our value proposition require?
- How do we strategically differentiate from the competition?
- Which strategic capabilities help us deliver on our value proposition?
7. Key resources
Main question: Which resources does our value proposition require?
Executing effective HR service delivery requires certain physical, human, and financial resources. A match between the available resources and the value proposition is key to successful HR service delivery.
Questions to answer here include:
- Which physical, human, and financial resources does our value proposition require?
- Which competencies enable us to deliver our value proposition and HR activities?
- Which competencies would enable us to drive more value?
- Which competencies do line managers need to deliver on HR’s value proposition?
8. Key partners
Main question: Which partners are required to deliver on the value proposition?
These partners include vendors, consultancies, and upskilling partners regularly used to optimize HR service delivery.
Consider answering these questions:
- Who are your key partners and suppliers?
- What services and resources are we acquiring from partners?
9. Cost drivers
Main question: Which activities are the most expensive?
Cost drivers form the final box, which helps balance the activities required to fulfill the value proposition with the available resources.
Questions to ask and answer here are:
- Which key activities are the most expensive?
- What are the most significant costs inherent to our HR value proposition?
- Which partners are the most expensive?
- Where are the most significant opportunities for digitization and automation?
- Is HR seen as a cost driver (focus on cost efficiency) or a value driver (focus on value creation)?
The HR canvas isn’t something that stands alone. This has two consequences that are good to consider before filling in this document. Firstly, the organizational strategy and key business priorities are the starting point – or input – for the HR canvas. Based on these priorities, your Customer Segments and the value you produce for them will shift.
Secondly, once the nine HR canvas dimensions are filled in, the HR department can use them to define their key performance indicators. This enables you to measure and assess:
- How well the HR organization is doing
- If it is delivering on its priorities
- And, as a result, if it contributes to the business strategy.

How to use the HR canvas in practice: An example
Let’s illustrate how the HR canvas model works with an example.
EdgeDotGrow is a founder-led SaaS company with 50 full-time employees, a recruiter, and a newly appointed HR manager. The company’s strategic priorities are:
- Retention of existing clients
- Scaling the organization
- Building the next version of the software product
- Establishing foundation governance and business processes required to sustain its fast growth.
The HR manager spoke with the relevant stakeholders during their onboarding and filled in the HR canvas. Core customer segments include the investors, founders, management team, employees, and critical third-party vendors.
After interviewing the different HR customer segments, the HR value proposition and operating model were defined. The HR manager aimed to increase self-service for the company’s employees. Key activities included attraction, employer branding, and establishing standard policies and processes.
The most significant value driver was having talent ready whenever the organization needed to expand. This was going to be done by:
- Building a strong employer brand
- Optimizing the recruitment cycle while complying with basic norms and;
- Ensuring the workforce stays motivated by providing a great employee experience.
The HR manager completed the canvas based on this information, identifying HR’s core customers, the value proposition, operating model, value drivers, activities, partners, and resources. The process resulted in the following overview:

Based on this canvas, the HR manager could define their HR KPIs. The most important ones, in this case, were the time to fill in days, KPIs related to employer branding, and the employee Net Promoter Score (eNPS).
This example shows how the HR canvas can provide a clear direction for the HR manager and their team, including the actions they need to take to reach their goals and the partners and resources they need to be successful.
Best practices for using HR canvas
The HR canvas is a management tool that helps to strategically map and define HR’s contribution to the various business stakeholders. Depending on the number of people involved, filling in the tool can take anywhere from thirty minutes to multiple days, but it will pay off quickly.
Here are a few elements for HR to keep in mind while filling in the canvas to make the most out of it:
- Start with the business in mind: Anchor your HR strategy with the organization’s overarching goals. Identify key business challenges and ensure HR initiatives directly address them.
- Involve and align with key stakeholders: Collaborate with senior leadership, department heads, and HR team members. Gather insights from employees to ensure HR initiatives align with workforce needs.
- Keep it simple and actionable: Focus on clear, concise inputs for each section of the canvas. Stick to key priorities rather than listing every HR activity.
- Upon completion, check back: After completing the canvas, review it with key stakeholders to confirm HR’s contribution aligns with their needs and to prevent scope creep.
- Review and update regularly: Approach the canvas as a living document that guides strategy rather than a one-time exercise. Revisit the canvas periodically (e.g., quarterly or annually) to reflect changes in business strategy. Adjust priorities based on new challenges, workforce shifts, or leadership direction.
- Link HR metrics to the canvas: Set your HR KPIs and metrics based on the HR canvas. For instance, if your HR value proposition focuses on improving retention, you should track turnover rates, employee engagement scores, and internal mobility. If your key activities include leadership development, measure participation rates, promotion rates, and leadership effectiveness scores.
HR canvas template
We have created an editable HR Service Delivery Model Canvas template to help you get started and make your work easier.
A final word
Despite the business often not fully seeing the alignment of HR solutions to its key challenges, HR’s contribution to business value is slowly but surely being recognized more and more across the board.
For businesses to thrive in the current (economic) climate, they need to embrace the power of HR and, through it, the power of their employees. However, this move will have no real positive impact unless HR itself is ready and willing to align with the ever-changing business it serves. The HR canvas is an indispensable tool to do so.
The post HR Canvas: A Practical Guide + Template for HR Leaders appeared first on AIHR.
]]>The post HR Scorecard: A Full Guide for HR Leaders appeared first on AIHR.
]]>In this article, we explain the HR scorecard, discuss its benefits and common metrics, explain the difference between the HR scorecard and a balanced scorecard, and provide some examples of HR scorecards. Let’s begin!
Contents
What is the HR scorecard?
Benefits of HR scorecard
Implementing the HR scorecard: 5 steps
Metrics to include on the HR scorecard
HR scorecard examples
FAQ
What is the HR scorecard?
The HR scorecard, also known as HR KPI scorecard, is a strategic HR measurement system that helps to measure, manage, and improve the strategic role of the HR department. It is a representation of leading HR indicators and key metrics that assesses the impact of HR activities on organizational performance.
Leading indicators are measurements that predict future business growth. These are called HR deliverables. They are also known as HR metrics and, more specifically, HR KPIs, as they are metrics linked to the business strategy.
Becker, Huselid, and Ulrich first published about the Human Resources scorecard in their 2001 book in an attempt to solve one of the key problems that HR has been facing in the past decades: the perception that HR doesn’t add to the company’s strategy.
HR scorecard vs. balanced scorecard
The terms HR scorecard and balanced scorecard can be confused, as they are sometimes used interchangeably in the field of HR.
The balanced scorecard is a broader framework, first introduced by Kaplan and Norton in the early 1990s and detailed in their 1996 book The Balanced Scorecard. Put simply, it is a strategy performance management tool. It organizes goals into four perspectives: financial, customer, internal processes, and learning and growth. Together, these perspectives provide a comprehensive view of what the organization aims to achieve.
The HR scorecard is based on the balanced scorecard framework but focuses specifically on measuring and improving HR’s contribution to the organization. It evaluates how well HR is achieving its goals, such as improving employee retention, streamlining recruitment processes, or enhancing training effectiveness.
Benefits of HR scorecard
HR scorecard can increase the impact of HR within your organization by focusing on measurable outcomes and actionable insights. Its benefits include:
- Alignment with business goals: By focusing on HR metrics and their impact, the HR scorecard helps illustrate how HR activities contribute to business success at an operational level. It connects day-to-day HR functions, such as recruitment and training, to the organization’s goals, providing measurable insights into areas where HR can improve or add value.
- Data-driven decisions: It provides measurable insights into important areas like recruitment, employee engagement, retention, and productivity, helping HR leaders make informed choices.
- Identifying areas for improvement. The HR KPI scorecard enables organizations and HR to determine where the HR department could perform better, making it easier to create targeted interventions and improvements.
- Improved accountability: Clear metrics hold HR teams accountable for achieving specific outcomes, such as reducing turnover or increasing employee satisfaction.
- Supporting strategic HR planning: The HR scorecard acts as a framework for HR to plan future initiatives, allocate resources effectively, and prioritize efforts that provide the most value.
Something to keep in mind
In a 2019 podcast interview, Dave Ulrich, one of the writers of the original 2001 publication on the HR scorecard, shared a more nuanced opinion about the intention of the HR scorecard.
According to Ulrich, the HR scorecard should not be about HR – but about enabling market opportunities, building competitive advantage, and driving business results. As the author puts it, “The most important thing HR can give an employee is a company that wins in the marketplace.”
Implementing the HR scorecard: 5 steps
There are five steps to develop an HR scorecard:
- Creating an HR strategy map
- Identifying HR deliverables
- Designing HR policies, processes, and practices
- Aligning HR systems
- Creating HR efficiencies,
Let’s go through them one by one while creating an example of an HR scorecard.
1. Creating an HR strategy map
To identify how HR can contribute to this business outcome, HR leaders can create a strategy map. The strategy map helps identify how HR is driving these business outcomes. The question here is: What HR practices drive the company’s strategic goals?
Let’s take a look at an example for the recruitment function.
A large European shipbuilding company wants to become the most innovative organization in its sector. In the external market, low-cost shipbuilding projects are increasingly moving to Asia, while European builders are the go-to for technologically advanced ships, like navy vessels and superyachts. For this reason, a high innovation ranking is tremendously important for the company’s future competitiveness.

As you can see, the company’s strategic goal is at the top. Next, HR has identified its recruitment contribution to this goal. The contribution is to hire more qualified professionals. The way to do this is to become a more attractive employer in the competitive technical shipbuilding labor market and decrease the time it takes to hire a new employee (lead time). This specific company had a fairly bad lead time and was losing candidates because of it.
2. Identifying HR deliverables
To measure this, you need to create HR deliverables or KPIs. The HR scorecard example below shows how you can measure these strategic goals. For example, the lead time is measured as the ‘time to hire in days.’ This is currently 38 but needs to go down to 25, which is a 34% improvement.

By using this recruitment strategy map and HR scorecard, the company has now identified the leading measurements for business success. In this case, some of the company’s leading indicators of success in achieving the business strategy are 1) becoming a top employer and 2) improving the quality of hire (the satisfaction score of the manager after 1 year in the HR scorecard).
Because of these clearly defined indicators, the HR department knows that increasing those two HR deliverables will contribute to the company’s goal of becoming more innovative, giving HR a more strategic role.
3. Designing HR policies, processes, and practices
Another step in the creation of an effective HR scorecard is related to policies, processes, and practices. Here, we look at what we can do to ensure that HR successfully achieves its key deliverables.
The idea here is that HR creates several High-Performance Work Systems (HPWS). An HPWS is a group of separate but interconnected HR practices designed to enhance effectiveness.
In the previous example, some key deliverables included a decrease in lead time and a high ranking in the top employer benchmarks. These deliverables can be supported through:
- Policies: A strong employer branding policy will help to build a strong reputation and become a top employer.
- Processes: Optimizing communication between recruiters and managers will decrease lead time. Often, managers take a long time to review resumes and plan interviews with candidates. Changing these slow processes into workflows that guarantee next-day action can decrease the time to hire by days, sometimes even weeks. This is one of the many processes that can be implemented to enable better performance on the HR deliverables.
Another example could be the application process for candidates. The candidate experience will be vital to attracting top candidates and ensuring a good rating in the top employer benchmark. - Practices: This looks at the specific practices that help HR achieve the aforementioned deliverables.
Developing policies, processes, and practices that create synergies is referred to as ‘bundles’ of practices. These practices work together to create synergy for the HR deliverables. This is also the core focus of the next step in the scorecard, aligning HR systems.

4. Aligning HR systems
Aligning HR systems is about ensuring that all HR practices complement and reinforce each other to achieve the organization’s goals. It’s not about technology or software systems but rather about creating consistency and cohesion across different HR activities.
For example, if your employer’s branding efforts target a specific type of candidate, the recruitment process should be tailored to attract and select those individuals. Similarly, while reducing lead times is important, rushing through the hiring process without maintaining quality can lead to poor hires—undermining the very goals HR is trying to achieve.
Aligning HR systems, such as recruitment, training, and performance management, ensures that all practices work in harmony to meet key deliverables and drive overall HR success.
5. Creating HR efficiencies
This step involves automating and streamlining HR processes, implementing best practices to improve the operational efficiency of the HR department, and leveraging technology. Think, for example, of:
- Optimizing resource allocation
- Automating routine tasks
- Increasing the overall effectiveness of HR initiatives.
There is one side note to make here: Sometimes, when creating an HR scorecard, some efficiencies must be sacrificed.
Let’s look at an example. To get a higher quality of hire, your cost of hiring someone might increase. In our above-mentioned example, the quality of hire is a strategic HR measurement. Investing money to improve the quality of hire is thus worth it. This justifies investments in assessments, employer branding projects, and other HR initiatives that boost the main HR deliverables.
Metrics to include on the HR scorecard
The metrics on the HR scorecard will vary based on your organization’s goals and focus. Here are examples of metrics from different areas of HR that you can include:
Engagement
- eNPS: The employee Net Promoter Score measures the likelihood of employees recommending their employer to others. As such, it is indicative of their engagement.
- Absenteeism rate: The absenteeism rate refers to the number of absent days divided by the number of available workdays in a specific period. It is an essential HR indicator that can, for example, indicate problems with engagement or the organizational culture.
Retention and turnover
- Employee turnover: Employee turnover measures the rate at which employees leave an organization during a specific period, often a year. There are various types of turnover (early, voluntary, functional, dysfunctional, etc.).
- Internal promotion rate: The internal promotion rate measures the frequency at which employees are promoted to fill open roles within a company during a particular period. A high promotion rate can indicate that employees have plenty of opportunities to grow and stay with the company longer. In contrast, a low retention rate may suggest that the wrong people are promoted to the wrong roles.
L&D
- Training ROI: Training return on investment refers to the profitability or efficiency of the money the company puts into training.
A popular way to measure training ROI is: Training ROI = (Return of Benefit – Investment Cost) / Investment Cost x 100 - Training hours per employee: This metric measures the average training hours per employee and indicates people’s commitment to L&D.
Recruitment
- Cost per hire: Cost per hire measures the costs related to hiring new employees, including expenses such as recruitment advertising costs, sourcing, onboarding, etc.
- Time to productivity: Time to productivity measures, as the term suggests, how long it takes for new employees to reach the desired level of performance in their role (this means having the required ability, knowledge, and skills to do essential tasks autonomously).
- Time to fill vacancies: The time to fill metric refers to the number of calendar days it takes to find and hire a new employee. It is often measured in terms of the days between the approval of the job requisition and the candidate accepting the offer.
HR scorecard examples
Once you have a good understanding of the HR scorecard creation process and potential metrics to include, take a look at three basic HR scorecard examples from different areas of HR to bring your own HR scorecard to life:
Recruitment
Develop and implement an excellent recruitment process
- Recruiting cost per employee
- New hire performance during their first 2 years
- Early new hire turnover
Develop strategic competencies
- % of strategic competencies available in the company
- Average time to close strategic competencies gap
Employee engagement
Increase employee satisfaction
- Employee Net Promoter Score (eNPS)
Create a positive work environment
- % of (early) turnover
% of referred candidates
Performance management
Optimize the performance management process
- % of employees hitting (or overperforming) their KPIs
- Number of performance feedback sessions held per year
Develop and implement top talent management practices
- % of managers who have been promoted internally
- Number of qualified employees per strategic position
A final word
The HR scorecard can be an excellent tool for organizations and HR to track and improve HR performance across its various functions. It enables HR to align its goals with those of the company, creates accountability, and improves transparency.
FAQ
The HR scorecard is an excellent tool for getting a clear picture of the HR department’s performance in your organization, the effectiveness of the various HR functions, and their contribution to the company’s business goals.
The KPIs on an HR scorecard will depend on the HR function it covers. Examples include time-to-hire for recruitment efficiency, employee turnover rate for retention, training ROI for learning effectiveness, and employee engagement scores for workplace satisfaction.
An HR dashboard is a visual tool that showcases data and metrics on HR activities, such as employee turnover, absenteeism, or recruitment status, often displayed in charts and graphs. In contrast, an HR scorecard focuses on tracking and aligning key HR metrics with strategic business goals, offering a more structured and strategic overview.
The post HR Scorecard: A Full Guide for HR Leaders appeared first on AIHR.
]]>The post What Is the Role of the HR Analyst? A Full Guide appeared first on AIHR.
]]>Contents
What does an HR Analyst do?
HR Analyst skills
How to become an HR Analyst
HR Analyst vs HR Business Partner
HR Analyst vs. HR Generalist
HR Analyst salary
HR Analyst career path
HR Analyst example job postings
FAQ
What does an HR Analyst do?
An HR Analyst, also referred to as HR Data Analyst or People Analyst, plays a key role in helping organizations make data-driven decisions related to their workforce. They analyze HR data, identify trends, and provide insights that improve processes like recruitment, retention, and employee engagement. The HR Analyst job growth rate is estimated to be 11%, highlighting the demand for these types of roles in the market.
Key responsibilities of the HR Analyst include:
- Collect and analyze HR data: Evaluate metrics like turnover rates, employee satisfaction, and absenteeism.
- Generate reports and dashboards: Present insights to HR teams and leadership to inform decision-making.
- Monitor workforce trends: Identify patterns in hiring, productivity, or retention to recommend improvements.
- Support compliance efforts: Ensure HR practices align with employment laws and company policies.
- Collaborate on strategy: Work with HR and management teams to develop strategies for workforce planning.
- Evaluate HR tools and systems: Assess the performance of HR software and suggest optimizations.
- Conduct salary benchmarking: Research market data to ensure competitive and fair compensation practices.
Note that the HR Analyst has a broad role and – depending on the organization – will be asked to focus on different tasks.
HR Analyst skills
The exact skills an HR Analyst should have will, again, depend on the organization. Quite a few organizations are looking for an HR Analyst with predominantly soft and HR skills. This makes the analyst’s function profile very similar to an HR Business Partner. Other organizations are really looking for a data analyst role. When applying for a job, read the job posting thoroughly to understand what type of role it is.
Here are some common skills that an HR Analyst should have.
1. Business acumen
Business acumen is becoming increasingly important for HR roles. The same holds true for the HR Analyst.
Before you analyze data, you need to know what project you will work on and how the data analysis will impact the business. Business acumen is an essential skill for any analyst who is involved in either simple data analysis or in an end-to-end analytics project.
2. Communication & consultation
Whether you’re spending most of your time analyzing data or only very little, you need to talk to the business, manage stakeholders and their expectations, and communicate the results of an analytics project to the relevant audiences. Hence, communication and consultation are essential for HR Analysts.

3. Relationship management
As an HR Analyst, it is key to effectively manage relationships and stakeholders. Expectation management is a requirement for analytics success. In addition, you need to keep the business involved in your analytics project and keep them up to date on progress and potential setbacks.
4. HR expertise
Whether you’re more on the business partner side of the analyst role or crunching numbers every single day, HR expertise is an essential skill. This expertise touches almost everything you do in your job.
HR expertise can be divided into three key areas:
- Knowledge of the science behind what we do in HR
- Knowledge of HR best practices
- Understanding of the key HR processes.
5. Data analysis
The HR data analyst is involved in the basics of data-driven HR in the organization. For most organizations, this entails (ad hoc) reporting and dashboarding.
In order to accurately report on HR data, the analyst is involved in the aggregation of data, maintaining HR data quality, and the analysis of data.
Depending on the data maturity of the organization, these reports can be ad hoc. Ad hoc reporting means that the information has to be manually retrieved from the systems for reporting and analysis. This kind of data often needs to be cleansed as well – which may take a lot of time.
More mature organizations have automated this process. This makes reporting less time-consuming, and the analyst can focus on analyses that add more value than basic reporting, like predictive analyses.
Competencies required for this include strong attention to detail and a strong drive to use data to answer business questions.
6. HR systems & implementation
HR data comes from HR systems, often referred to as the Human Resources Information System (HRIS). These transactional systems contain most of the data that the HR Analyst works with.
Implementing, maintaining, and updating these systems is part of the HR Analyst’s responsibility.
7. Global and cultural awareness
HR data often spans multiple regions, especially in large international organizations, making global and cultural awareness a key skill. As an analyst, you’ll work with data from diverse locations, requiring an understanding of how cultural differences influence HR practices, employee behaviors, and data collection methods. This awareness helps you interpret data accurately and provide insights that are relevant across different cultural contexts.
How to become an HR Analyst
Breaking into HR analytics or people analytics requires a mix of HR knowledge, data skills, and familiarity with HR technology. Whether you’re coming from an HR background or a more technical field, the right approach can help you bridge the gaps and stand out to employers. Here are some key steps to build the skills and experience needed for an HR analyst role:
Understand the job requirements
As we’ve already mentioned, job requirements will differ per role and organization. Check job openings for HR analyst roles in your desired location or field to identify common skills and tools required.
The standard requirement for an HR analyst position is domain experience in HR. HRM studies or a background in industrial and organizational psychology are usually considered highly relevant.
A background in economics, statistics, or analytics is also beneficial. People with these kinds of backgrounds bring a unique set of quantitative skills that most people with an HRM background are missing. This background often requires complementary training in Human Resources.
Get hands-on with HR systems
Many HR jobs require HRIS experience, so learning to work with systems like Workday, SAP SuccessFactors, or Oracle HCM is key for an HR Analyst job.
Some of the things you can do include:
- Take online courses on digital HR and analytics
- Explore interfaces and reporting features of HRIS providers offer demo accounts or trial versions
- If you’re already working in HR, check out the HR reports, dashboards, or data extraction in your company’s HRIS.
Develop visualization & reporting skills
HR Analysts frequently use tools like Tableau, Power BI, or Qlik to create HR dashboards and reports. A must-have skill is proficiency in Microsoft Excel. This is still used in most organizations and an understanding of how to combine worksheets and analyze large amounts of data using pivot tables are usually considered elementary.
You also need to build a foundational understanding of key HR metrics like turnover rates, employee engagement, and recruitment efficiency.
Gain practical experience
Real-life experience is one of the best ways to build confidence and strengthen your resume. If you’re transitioning into HR analytics, look for opportunities to work with HR data in your current role or take on projects that showcase your skills.
Some ways to gain experience:
- Volunteer for HR reporting tasks if you’re already in an HR-related role
- Work on personal projects—analyze publicly available HR datasets to practice data visualization and reporting
- Apply for internships or entry-level roles in HR analytics to get exposure to real-world HR data
- Freelance or contribute to HR analytics projects on platforms like Kaggle or GitHub.
Prepare for job interviews
When applying for jobs, it’s helpful to review common HR analyst interview questions to understand what employers look for.
Practice explaining HR metrics, data analysis techniques, and how you’ve used HR tools in past experiences to address the interviewees’ queries. Be ready to discuss real-world scenarios, such as how you would analyze turnover data or improve HR reporting.
Stay updated on HR analytics trends
HR technology and analytics are evolving quickly, so staying informed can give you a competitive edge. You can start by following HR analytics thought leaders and pages on LinkedIn and industry blogs.
Other great ways of keeping up to date with the developments in the field include attending webinars and conferences on HR technology and workforce analytics and joining HR analytics communities and forums to learn from professionals in the field.
HR Analyst vs HR Business Partner
We already hinted a few times about the similarities between the HR analyst and the HR business partner’s job. Both roles contribute to HR strategy but focus on different areas.
An HR Analyst specializes in collecting, analyzing, and reporting data, using technical skills to provide insights. In contrast, an HR Business Partner (HRBP) works closely with managers, using soft skills to solve HR-related challenges and align people strategies with business goals.
The HR BP acts as an internal consultant, advising on operational and strategic HR matters. When data-driven solutions are needed, the analyst steps in to define problems and provide insights.
As HRBPs gain analytics skills, the line between these roles can blur, leading some companies to use the term “HR Analyst” when they really mean “HR Business Partner.”
HR Analyst vs. HR Generalist
While both roles contribute to HR operations, they have distinct focuses.
An HR Analyst works with HR data, reporting, and workforce analytics, using tools like Excel, Power BI, and HRIS to identify trends and improve decision-making. Their role is more technical and data-driven.
An HR Generalist, on the other hand, handles a broad range of HR functions, including recruitment, employee relations, compliance, and benefits administration. They are involved in day-to-day HR operations and often serve as the first point of contact for employees.
While HR Analysts focus on data and insights, generalists work more directly with employees and HR policies. Some companies may blend these roles, but in larger organizations, they are typically separate functions.
HR Analyst salary
Salaries for the HR analyst role can vary wildly depending on the size of the company, the location, and the experience of the analyst. In the United States, you can expect to earn between $67,000-$110,000 in the midwestern United States, while someone doing the same job in New York City could expect to earn between $69,000 and $117,000 per year.
Payscale.com puts the average base salary at around $65,000.
HR Analyst career path
It is hard to map a well-defined career path in today’s world. Usually, you start as a junior analyst and can grow your way to a senior analyst position.
The data-driven mindset of an analyst is increasingly popular and looked for in management positions.
Career paths to becoming HR Manager and HR Director are available, as well as horizontal paths towards (senior) Human Resources Generalist, or the more specialized Human Resources Information System Analyst and HRIS manager.
HR Analyst example job postings
Because defining what an HR Analyst exactly differs from business to business, we’ve looked at job postings from companies that hire HR Analysts to see the commonalities and dissimilarities in responsibilities and requirements.
A brief job analysis
We conducted a brief analysis of HR Analyst job postings to help you understand the role of the HR Analyst even better. Here are a few interesting details:
- Many job postings explicitly mention advanced Excel skills, including PivotTables, VLOOKUP, and data manipulation.
- Some job postings emphasize data visualization tools like Power BI, but none require deep statistical expertise in SPSS, STATA, R, or Python.
- Many roles require familiarity with Workday, SAP SuccessFactors, or other HR systems.
- A lot of companies seem to be looking for candidates with Excel expertise and an interest in HR rather than HR professionals with a strong data background, making these positions accessible for early-career professionals.
- A significant portion of job postings emphasize administrative HR tasks, such as updating HR data, preparing reports, and supporting employee engagement initiatives.
A final word
To sum up, if you’re looking to start a career as an HR analyst, focus on building strong Excel skills and gaining familiarity with HR systems like Workday or SAP SuccessFactors. Entry-level HR roles that involve reporting, data management, or HR operations can be a great stepping stone, as many companies prioritize candidates with hands-on experience in these areas. Taking courses in HR analytics or data visualization tools like Power BI can also help you stand out.
FAQ
The HR analyst plays a key role in collecting, structuring, analyzing, and reporting on HR processes and data. Essential competencies include data analysis, business acumen, relationship management, HR expertise, communication, HR systems, and cultural awareness.
Salaries for the HR analyst role can vary wildly depending on the size of the company, the location, and the experience of the analyst. In the United States, you can expect to earn between $67,000-$117,000.
There is no set way to become an HR analyst. Many professionals come from backgrounds in psychology, business administration, HR management, or data analytics. Strong Excel skills are a must, as data analysis plays a central role in the job. While experience with R or Python is often optional, having these skills can give you a competitive edge. Gaining hands-on experience with HR systems (e.g., Workday, SAP SuccessFactors) and data visualization tools (e.g., Power BI, Tableau) can also help you stand out.
The post What Is the Role of the HR Analyst? A Full Guide appeared first on AIHR.
]]>The post What Is Organizational Development? A Complete Guide appeared first on AIHR.
]]>In this complete guide, we delve into organizational development, its goals, how it works, and describe some examples. By the end, you will have a foundational understanding of organizational development and its significance in building thriving workplaces.
For a quick reference to key steps and strategies, download our Organizational Development Process Cheat Sheet and start applying OD principles effectively in your organization.
Contents
What is organizational development?
Goals of organizational development
Organizational development vs. Human Resources
Examples of OD interventions
Stages of organizational development
Organizational development process
Real-life organizational development examples
Organizational development skills
Organizational development certification
FAQ
What is organizational development?
Organizational development (OD), also referred to as organization development, is a strategic approach to improving an organization’s effectiveness, adaptability, and overall health. It’s a critical and science-based process that builds organizations’ capacity to change and achieve greater success by developing, improving, and reinforcing strategies, structures, and processes.
OD involves planned interventions and initiatives designed to support growth, innovation, and cultural transformation, often through employee engagement, leadership development, and process improvement.
Here’s a closer look at the main elements of this definition (adapted from Cummings & Worley, 2009 research):
- Critical and science-based process: OD is an evidence-based and structured process. It’s not a quick fix or an experiment of trying something out to see what happens. OD uses scientific findings as input and creates a structured and controlled process in which assumptions are tested. Then it examines whether the outcomes reflect the intention of the intervention.
- Building capacity to change and achieve greater effectiveness: Organizational development is aimed at organizational effectiveness. Therefore, it has a number of (business) outcomes. These can differ between organizations, but they usually include financial performance, customer satisfaction, organizational member engagement, and an increased capacity to adapt and renew the organization. These are not always clear-cut, yet, however they are defined, they are about building a competitive advantage. We will explore these outcomes later in this article.
- Developing, improving, and reinforcing strategies, structures, and processes: Organizational development involves changes in strategy, structure, and/or processes focusing on an entire organizational system. It can be applied to the whole organization, one or more locations, or a single department.

In organizational development, the company’s main stakeholders are both internal and external. Management and employees are internal stakeholders. External stakeholders include customers, investors, suppliers, communities, and governments.
Organizational design has become a trusted and needed practice in today’s business climate that is characterized by Volatility, Uncertainty, Complexity, and Ambiguity (VUCA). This plays out in many ways, including the following:
- Globalization is leading to a much greater interconnectedness and opening up organizations to worldwide opportunities and threats.
- IT is redefining traditional business models, creating innovative companies with the ability to scale their services to a worldwide audience in only a few years. For instance, Facebook reached one million users within a year of its launch, and Snapchat garnered 10 million active users in its first year. TikTok’s growth has been even more remarkable, reaching over 340 million users in the year after launching.
- Business systems are becoming better at measuring relevant data, changing the way success is measured.
- Advanced people analytics are helping to further drive organizational outcomes.
This VUCA world requires new agility from organizations. Organizational development strategies are the means to that end.
With change being a constant factor, OD is an integral approach to ensuring stability that differs from the incidental change process. OD focuses on building the organization’s ability to assess its current functioning and tweak it to achieve its goals. It is, therefore, a continuous process, whereas change processes are often temporary.
Understanding and applying organizational development principles is essential for creating a resilient and competitive business environment.
With AIHR’s Organizational Development Certificate Program, you’ll learn how to design structures, processes, and strategies that foster continuous improvement and adaptability.
Goals of organizational development
The goals of organizational development vary between organizations. In corporate companies, increasing profits is likely to be a chief concern. Within non-profits, cultural values are of high importance. And in health services, adaptability is key to maintaining good functioning.
If there were one central goal for OD, it would be to increase the organization’s competitiveness. Competitiveness is the idea that every organization has unique resources and competencies that help it win in the marketplace.
These resources include:
- People: Visionary leaders like Steve Jobs or collaborative teams like those at Google.
- Innovative products: Groundbreaking offerings like the iPhone.
- Superior service: Companies like Four Seasons Hotels provide exceptional customer experiences.
- Robust culture: Employee-focused environments exemplified by Zappos.
- Agility in market response: The capacity to swiftly adapt to changing market demands, seizing opportunities to secure revenue growth in the coming years.
OD develops aspects that help a business outperform its competition. The following sub-goals contribute to fulfilling this ultimate goal of boosted competitiveness:
- Improving efficiency and productivity: OD interventions engage employees and help them become more efficient and productive by addressing inefficiencies and equipping them with the required skills to meet changing needs.
- Enhance organizational adaptability: OD emphasizes the impact that behaviors, attitudes, beliefs, and attitudes have on the organization and how individuals, systems, and processes can encourage a more adaptable and resilient culture that can better navigate change.
- Develop leadership capacity: A key component of OD focuses on talent development. Equipping current and future leaders with new and necessary capabilities ensures a reliable leadership pipeline.
- Improve decision-making processes: Because OD is data-backed, teams can make decisions based on evidence and not assumptions. It also identifies and addresses communication breakdowns so information can flow freely to decision-makers.
Organizational development vs. Human Resources
Many OD interventions relate to Human Resource Management functions. Policies such as performance management, goal setting, appraisal, and talent management practices are all important in achieving effective organizational development.
However, whereas HRM focuses specifically on people practices, OD takes a more holistic approach. Using tools like organizational design, work design, and more traditional people interventions, OD can operate at all levels of the organization. These levels are trans-organizational, organizational, group, and individual. However, the focus is always on strategic themes, whereas HR is often more operational.
Sometimes, OD functions are located in the HR function, but not always. It may be part of a services department, corporate strategy, or internal consulting. External strategy consultants also frequently utilize OD techniques in change management projects.
Both HRM and OD have their roots in the business strategy – the mission, values, and vision of the organization. Both outline the actions needed to implement that strategy in their respective fields. In addition, many early people analytics initiatives originate from the OD department.
OD techniques are very powerful. For an HR professional, there are huge benefits to mastering them. The term “organizational development” actually emerged in the 1960s as a way to describe managing the behavioral aspects of people within organizations.
Understanding OD means you can identify which elements of core HR functions need focus in order to support the organization as a whole in becoming more efficient. OD provides an integrated way of approaching these challenges.
Check out our Learning Bite to learn everything you need to know about Organizational Development for HR!
Examples of OD interventions
Organizational development is a complex, in-depth process with different types of interventions. Using the work of Cummings and Worley (2009) as a basis, this section covers 15 organizational development interventions across four categories:
- Human process interventions
- Technostructural interventions
- HRM interventions
- Strategic change interventions.
Although this is not an exhaustive list, it aims to help you grasp this vast topic better and understand how OD relates to core HR functions.
Human process interventions
Human process interventions are change programs that relate to interpersonal relations, group, and organizational dynamics. These are some of the earliest and best-known OD interventions.
1. Individual interventions: These interventions are targeted at the individual, often aimed at improving communication with others. With these, an employee is coached on counterproductive interpersonal behaviors.
2. Group interventions: These interventions are aimed at the content, structure, or process of the group:
- The content is what the group is focused on
- The structure is how a group is designed to act on the content
- The process is how the group carries out its core tasks.
For example, a contact center focuses on taking complaints from customers. It has a hierarchical structure with a director, managers, and customer service staff. The contact center’s process is to record all complaints as quickly as possible. An intervention could be, for example, to optimize how the contact center handles complaints and only escalate a certain percentage to management based on predefined criteria.
3. Team building: Team building is the best-known OD intervention. It refers to activities that help groups improve their collaboration and task accomplishment. Examples of team-building activities are volunteering, team sports, and group games.
4. Intergroup relations interventions: Intergroup relations interventions aim to diagnose and improve the interactions, communication, and collaboration between different groups or departments in an organization. This process involves identifying problems or conflicts between groups, setting improvement priorities, and implementing solutions to foster mutual understanding and cooperation.
An intergroup relations intervention could involve facilitating a workshop between the sales and operations teams to address miscommunication and align expectations on order fulfillment timelines.
5. Large-group interventions: These interventions aim to bring together a large number of organization members and external stakeholders to work together. They may address organization-wide problems or implement changes of structure or direction.
For example, if you run a care home, you would seek feedback from service users, relatives, and staff on ways to improve the quality of life for residents. This could involve starting new activities or changing the menu options. These meetings are often referred to as “open space meetings,” “world cafes,” “future searches,” and “appreciative inquiry summits.”
Technostructural interventions
Technostructural interventions refer to change programs aimed at the technology and structure of the organization. These are becoming increasingly relevant as new technologies emerge rapidly.
6. Organizational (structural) design: An organization’s functional structure is crucial to its operation. You are likely familiar with the traditional hierarchical organizational chart. Other common structures are divisional, matrix, process, customer-centric, and network.
Key activities in organizational design are restructuring and downsizing. This involves rethinking how work is done, preparing the organization, and reshaping it around the new business processes.
7. Total quality management: Total quality management is also known as continuous process improvement, lean, and Six Sigma. It grew out of a manufacturing emphasis on quality control.
It places customer satisfaction as central to an organization’s long-term success. To achieve this, there is a strong focus on total employee involvement in the continuous improvement of products, processes, and workplace culture. Companies such as Toyota and Motorola use this intervention.
8. Job enrichment. Job enrichment is part of work design. The goal is to create a job that is interesting and challenging for the person doing it. Factors to be taken into account are skill variety, task identity, task significance, autonomy, and feedback.
Human Resource Management interventions
Human Resource Management interventions are organizational development techniques that focus on how the individual is managed. Many of these fall under HRM functions.
9. Performance management: Good performance management includes techniques such as goal setting, continuous feedback, performance appraisal, and reward systems.
10. Developing talent: This includes talent management practices like coaching, mentoring, career planning, development interventions, and management and leadership development.
11. Diversity interventions: Diversity is a source of innovation and financial outperformance. It includes age, gender, race, sexual orientation, disabilities, culture, and value orientation. These OD intervention techniques are aimed at increasing diversity.
12. Wellness interventions: Employee wellness interventions include stress management programs and employee assistance programs. They address social factors and aim for a healthy work-life balance.
Strategic change interventions
Strategic change interventions are organizational development techniques focusing on the change processes that shake the organization to its core. The OD department plays a crucial part in executing this change.
13. Transformational change: This is a process that involves changing the basic character of the organization, including how it is structured and operates. For example, Nintendo is famous for video games. However, the company was founded in 1889 to create card games. Due to changes in consumer interests, Nintendo shifted to electronic toys and later video games in the 1970s.
14. Continuous change: Continuous change is an intervention that enables organizations to improve gradually by making small incremental changes. A popular example is the learning organization. This approach places more importance on learning from mistakes and failures than punishing them.
15. Transorganizational change: Transorganizational change involves change interventions that move beyond a single organization. This includes mergers, allying, acquisitions, and strategic networking. A common type of trans-organizational change is when a company buys or merges with a competitor.
As we mentioned, this is not an exhaustive list. Techniques like financial planning, long-range forecasting, integrating technology, workforce planning, and designing appraisal systems can be added, as well as many, many more.
Stages of organizational development
Organizational Development is fundamentally about change, and like any change process, it unfolds in stages. While various authors propose different frameworks, we can generally establish the following stages of organizational development, each addressing key aspects of initiating, managing, and embedding change within an organization.
1. Entering and contracting
OD’s initial stage occurs because an organization’s leaders see a matter that needs to be addressed. Reduced revenue, impending external factors, internal conflicts, or increased employee turnover can indicate a deeper problem.
Once the problem is identified, the OD practitioner meets with management to understand the issue and assess the situation. From there, the OD expectations can be set.
2. Diagnosing
The diagnosing phase is the time to gather data and analyze the circumstances to find the root cause of the issue and determine the necessary OD steps. OD practitioners collect data to analyze and interpret the problem through observations, surveys, interviews, or by looking at currently available data from work systems. Then they present the diagnosis to the stakeholders with insight that demonstrates why the changes need to take place.
3. Intervening and taking action
The next stage is strategic planning. This step transforms the diagnosis into an action plan that includes detailed steps and which interventions will enact the change. These coordinated activities will intentionally disrupt how things are usually done.
Delineating the success criteria is a major part of the change process. Progress cannot be measured adequately without well-defined standards.
4. Evaluating and feedback
Once the organization has implemented the OD plan, it must continue to monitor it. This phase assesses if the interventions are effective and whether they need adjustments or redirection. The OD professional meets with the (internal) client to discuss the data and ensure it is interpreted correctly and consistently.
5. Termination/exit
The OD process concludes after the changes have been incorporated into day-to-day operations. A plan is set for sustaining and monitoring the transformation that supports employee concerns as they acclimate to the new systems and conditions.

Organizational development process
While these stages might look straightforward, the organizational development process is often complex and iterative. It requires continuous feedback, adaptation, and collaboration to effectively address challenges and achieve sustainable organizational change. We will break the core aspects of OD processes down into seven steps.
The OD process is not unlike the people analytics cycle, which involves detecting a problem, gathering data, analyzing it, presenting it, and implementing new policies.
We’ll follow an example of an OD endeavor throughout these seven stages. Let’s say the X-ray department in health services spans three hospitals in a city, all run by the same organization. For decades, the organization has recruited administration staff to work at each specific hospital. However, when sickness absences occur, there is often no staff available to cover.
This sparked the need for change through the OD process, as the recurring staffing issues highlighted inefficiencies in the current system. The organization recognized the necessity of a more flexible and collaborative approach.
1. Scope out the problem (Entering and contracting stage)
including external changes, internal conflicts, complaining customers, loss of profit, a lack of innovation, high sickness absences, or employee turnover. These events are usually symptoms of a deeper problem.
In our example, the admin team at the three hospitals has problems with not having enough staff to cover sick leave. The staff are only trained to work at one particular hospital. The secondary problem is the high cost of this, due to the need to hire agency staff frequently.
2. Evaluate the current situation (Diagnosing stage)
The OD professional would review HR and financial records at the three hospitals. This would provide data on sick leave levels and the costs of using agency staff.
Different organizational development models are used to run these diagnoses. Below, you see three input-process-output (IPO) models. They help structure the different design components of organizations (note the resemblance to Galbraith’s star model). This model clearly shows the different design components that play a role at different organizational levels (i.e., organizational, group, and individual).

3. Collect and analyze relevant data (Diagnosing stage)
The OD practitioner may decide to interview employees in the admin team about why they take sick leave and if any aspects of the organization impact doing so.
Data collection is often time-consuming but critical for a project’s success. Important factors to remember are confidentiality, anonymity, a clear purpose, observer-expectancy bias, and the Hawthorne effect.
Observer-expectancy bias is when the responses of the observed are influenced by the observer’s expectations. The Hawthorne effect refers to the famous Hawthorne studies where subjects behaved differently purely because they were being observed.
Another effect to keep in mind is a regression to the mean. This refers to the statistical phenomenon where extreme events or outlier situations tend to move closer to the average or typical state over time. Essentially, when something is unusually high or low, it is likely to become less extreme in subsequent occurrences simply due to natural variation.
For example, if a consultant is brought in during a crisis, the severity of the crisis may decrease over time—not necessarily because of the consultant’s interventions but because extreme situations often stabilize or improve on their own. This means that a dire situation is less likely to spiral further out of control and more likely to return to a more average state, illustrating the concept of regression to the mean.
So, bringing in a consultant during extreme circumstances decreases their severity simply because time passes. The situation is less likely to go from dire to even worse and more likely to go from really bad to just bad—hence, regression to the mean.
4. Consult findings with stakeholders (Intervening and taking action stage)
In this phase, it is key for the OD consultant to give information back to the client in an understandable and accomplishable way. It must be relevant, descriptive, verifiable, timely, limited, significant, comparative, and spur action. Techniques like storytelling and visualization can be used to do this successfully.
The OD consultant could present their key findings to management via a slide deck. They could also provide a detailed report, which management can delve into more deeply before deciding which changes to implement at the hospitals.
5. Design intervention and implement change (Intervening and taking action stage)
After providing the client with feedback, it’s time to create an intervention. This intervention must fit the organization’s needs and be based on causal knowledge of outcomes. In addition, the organization needs to be able to absorb the changes successfully.
A possible intervention the organization could implement at the three hospitals is to train all current and new staff to work across all hospital locations. The criteria for success would be less use of agency staff and more in-house employees covering sick leave across the hospitals.
6. Evaluate and monitor the change (Evaluating and feedback stage)
The next phase is about executing the change intervention. Estimations put the failure rate of change between 50-70%. Even though this is not entirely true, no one can doubt that change is hard.
Effective change management involves motivating change, creating a vision, developing support, managing the transition, and sustaining momentum. Well-known change models include John Kotter’s eight steps to transforming your organization.
At the hospitals, not all staff will likely want to shift from working at one site to working across three. Some staff could quit. Management will need to think carefully about how to convince staff to come on board to support this change.
7. Institutionalization of the change/Change has become the new norm (Termination/exit stage)
Once a system has been implemented, opportunities for improvement start to show. Addressing them and making incremental changes will improve user and employee experience.
The need for all staff to work across three hospitals may require the organization to find a way to reduce travel costs for employees. This could be done by paying staff a bit more to offset the added costs or introducing a low-cost or free shuttle bus for staff.
Lastly, effective organizational development interventions measure their own success and are created in a way that enables comparison between the state of affairs before and after.

Real-life organizational development examples
Seeing how different companies have applied organizational development strategies is a helpful way to understand how they work in practice.
Let’s look at three examples:
Creating a learning culture at Southwest Airlines
Before the end of 2020, Southwest Airlines leaders were not required to participate in leadership development beyond their initial training. This meant that the longer leaders stayed with the company, the more outdated their learning became.
The airline implemented a new leadership development strategy to create a learning culture with ongoing training on new techniques and skill sharpening. Leaders must commit to attending several learning events each year and have embraced these opportunities to expand their knowledge and abilities.
Evolving the employee value proposition at Procter & Gamble
After over 185 years in business, multinational consumer goods corporation Procter & Gamble Company (P&G) leaders understood that they needed to make certain changes to stay current. This includes how they reach potential employees.
P&G’s previous employee value proposition reads like a checklist of what to expect. After consulting with team members and formulating a fresh approach, they launched a reimagined EVP.
It’s depicted as an equation based on words from P&G’s Purpose Values and Principles statement, “Our quest for mutual success is what ties us together.” It’s called “P&G + Me = Mutual Success.” The new version is an interactive narrative about the company’s central issues and employees.
Rebranding Dunkin’
The Dunkin’ Donuts restaurant chain rebranded in 2019 by shortening its name to Dunkin’. Inspired by the popularity of its coffee, leaders expanded from donuts to tap into Starbucks’ market share.
At the time, Dunkin’ U.S. President David Hoffmann explained, “Our new branding is one of many things we are doing as part of our blueprint for growth…”
Despite the name change, the company kept the same font and colors from the original 1973 logo to remain recognizable. However, dropping the word “donuts” took the emphasis off pastries and broadened its brand to customers who may not be keen on donuts.
Organizational development skills
Practicing organizational development requires certain capabilities. Devoted OD specialists must acquire these skills and gain experience in them. These capabilities are also advantageous for HR professionals who play a key role in driving organizational change.
These skills enable OD and HR professionals to effectively diagnose issues, facilitate collaboration, design and implement change initiatives, and ensure the long-term success of development efforts within their organizations.
Key organizational development skills include:
- Business acumen: The ability to comprehend and navigate business situations. It involves a thorough understanding of how a business operates, what its mission and goals are, and how its different functions relate to each other. A person with business acumen is financially literate and a strategic thinker who makes informed, effective decisions.
- Change management: The ability to guide others through transition. Change management requires a blend of technical and interpersonal skills such as strategic planning, leadership, analytical thinking, communication, mediation, and empathy.
- Project management: The ability to oversee projects from inception to completion. Successful project management entails organization, time management, communication, negotiation, problem-solving, and risk management capabilities. Familiarity with the project subject matter and project management tools and software are also key.
- Data analysis: Proficiency in collecting, analyzing, and interpreting data. Because OD is an evidence-based process, it relies on data and its interpretation for decision-making.
Organizational development certification
Becoming an OD consultant often requires a Bachelor’s degree. Relevant degrees include training and development, Human Resources, or instructional design. Related work experience, such as in HR, is also useful.
Holding an organizational development certification demonstrates an understanding of the field and makes a strong OD job candidate. The Organizational Development Certificate Program by AIHR is designed specifically for HR professionals who want to learn how and when to apply OD techniques in their work.
A final word
One of the most common barriers to implementing organizational development is the complexity it can present to an organization’s leaders. HR professionals with a solid grasp of OD principles are uniquely positioned to bridge this gap and lead meaningful and sustainable change.
At its core, organizational development is about empowering an organization to achieve its strategic goals through the engagement and optimization of its most valuable asset—its people. By mastering OD practices, HR professionals can not only boost the effectiveness of the HR function itself but also drive improvements that impact the entire organization. Ultimately, a commitment to OD fosters a culture of continuous growth, resilience, and excellence.
To continue learning about organization development, we highly recommend Cummings & Worley’s 2009 book Organizational Development & Change.
FAQ
Organizational development is a critical and science-based process that helps organizations build their capacity to change and achieve greater effectiveness by developing, improving, and reinforcing strategies, structures, and processes.
Many OD interventions relate to HRM, including performance and talent management interventions. However, while HRM focuses specifically on people practices, OD takes a more holistic approach, examining individuals, teams, and organizational systems.
Organizational development in HR involves changes and improvement of the processes and structures that are part of HR’s responsibility. These include processes and systems related to performance management, talent management, diversity, employee wellness, etc.
The five stages of organizational development are as follows:
– Entering and contracting (Assessing the situation and exploring the problem)
– Diagnosing (Data collection and fact-finding)
– Intervening and taking action (Interpreting data and creating an action plan for interventions)
– Evaluating and feedback (Monitoring outcomes and adjusting)
– Termination/exit (Finishing up and ensuring changes are sustainable)
The post What Is Organizational Development? A Complete Guide appeared first on AIHR.
]]>The post HR KPIs: Guide, 20 Examples & Free Template appeared first on AIHR.
]]>In this article, we dive into the details of KPIs in HR. We will discuss what HR KPIs are and how you can use them, provide a framework for setting them up for your HR department and organization, and share a handy HR KPI template. Let’s dive in.
Contents
What are HR KPIs?
How does HR use KPIs to support organizational needs?
HR KPI examples
HR KPIs vs metrics
Characteristics of good HR KPIs
Leading vs. lagging KPIs
HR KPIs case study
HR KPI template
HR KPI best practices
FAQ
What are HR KPIs?
Human Resources key performance indicators (HR KPIs) are strategic HR metrics used to assess how effectively HR supports the organization’s overall goals. An HR KPI measures how successful (or not) HR contributes to and achieves the organization’s HR strategy.
Since HR strategy is built to support the organization’s broader strategy, HR KPIs reflect how HR performance ties into the company’s objectives. They are typically linked to outcomes that drive business success and are often derived from frameworks like the Balanced Scorecard. To achieve a specific business goal, HR may track multiple KPIs, each representing a smaller, actionable target.
Ideally, all KPIs should work together to advance the HR strategy. However, conflicts can arise. For example, if you have to cut costs in your learning and development budget while also trying to stimulate innovation, it creates a strategic challenge. In such cases, HR must balance competing priorities, such as encouraging innovation with fewer resources.
A practical example
Dodgers is an organization trying to innovate in a highly competitive landscape. For this reason, the board of directors decided to cut costs everywhere except in the product innovation department. The question is, how does this goal translate into HR KPIs?
The entire organization, including HR, needs to save money. This reduction could, for example, apply to recruitment costs. They are currently at $500,000 and must be reduced to $400,000.
In this case, ‘Recruitment cost in Dollars’ is the KPI. Its current score is $500,000, and the target for this KPI is $400,000.
A second HR KPI could be ‘innovative behavior’ measured in the organization’s annual employee engagement survey. Its current score on a 10-point scale is 6.2, and the target for this KPI is 7.5 or higher. Achieving this will be quite the challenge.
How does HR use KPIs to support organizational needs?
HR KPIs provide valuable insights that help improve decision-making, monitor workforce performance, and plan for future talent needs in multiple ways, such as:
- Aligning HR activities with business goals: HR uses KPIs to ensure that its strategies, like hiring or employee development, contribute directly to broader company objectives.
- Data-driven decision-making: By analyzing KPI progress, for instance, by using an HR dashboard, HR teams can make informed, data-based decisions and choices about policies, resource allocation, and workforce strategies.
- Tracking workforce performance: KPIs like employee productivity or goal attainment help ensure that teams are effectively meeting their business targets.
- Monitoring employee engagement: Metrics such as engagement survey scores or turnover rates signal morale and satisfaction, which impact retention and organizational performance.
- Supporting workforce planning: HR uses data and metrics to anticipate and address current and future staffing and talent needs, ensuring the organization has the right people in the right roles.
Learn to optimize HR KPIs for business success
Develop your skills in efficiently measuring the right KPIs to demonstrate the value of your HR initiatives.
AIHR’s HR Metrics & Dashboarding Certificate Program teaches you how to select and use the right KPIs, as well as how to provide a template to evaluate your organizations’ HR metrics.
HR KPI examples
The KPIs used in an organization are unique. Every organization is different – and its KPIs should reflect that uniqueness.
Many resources you’ll find online list tens, sometimes even close to a hundred HR KPI examples. Most of these, however, are simple HR metrics that can offer useful insights into HR operations but they won’t directly contribute to the organization’s strategy.
Here is a list of 20 key HR metrics examples that will:
Absence rate
The absence or absenteeism rate in the organization is typically calculated by dividing the number of working days in which the employee was absent by their total number of working days. High absence rates may signal underlying issues like low morale, burnout, or workplace inefficiencies, all of which impact productivity and the organization’s ability to meet its goals.
Absence cost
The total cost of absence is calculated by including employee pay, the cost of managing absence, and replacement cost.
This KPI is especially relevant for European countries with strong labor unions and robust employee protections because these factors often lead to higher costs associated with employee absence. These protections might include guaranteed paid sick leave, extended leave policies, or legal requirements for employers to cover wages during absence, all of which increase the financial burden on organizations.
Benefits satisfaction
Satisfaction with different types of employee benefits is usually measured through an engagement survey but can also be gauged in stay interviews. The insights from these surveys can help reduce employee turnover.
Employee productivity rate (EPR)
Although this metric is hard to calculate, it measures the productivity of a company’s workforce over a certain period. It can help managers understand whether they need to hire more (or fewer) people to achieve their goals.
Employee satisfaction index
Employee satisfaction can be measured via attitude, engagement, and pulse surveys, as well as stay and exit interviews. Unsurprisingly, dissatisfaction is a common reason for employee turnover.
Employee engagement index
Employee engagement is measured through the same tools as employee satisfaction (minus the exit interview). High employee engagement predicts higher productivity, better customer service, lower turnover, and many other relevant and positive outcomes.
Employee innovation index
Innovation can be measured using attitude or engagement surveys and is increasingly becoming a key driver of business success. It’s part of HR’s role to enable this innovation within the organization.
Employee wellbeing index
This metric provides a composite score from surveys measuring employees’ mental and physical health, work-life balance, stress levels, sense of purpose, and other factors that impact productivity and retention.
Internal promotion rate
This KPI is measured by dividing the number of senior functions filled through internal promotion by the total number of senior positions filled. Internal hires are often up to speed faster, reduce the risk of bad hires, and stay longer in the role.
Net Promotor Score (NPS)
A Net Promoter Score is an excellent way of measuring the degree to which someone would recommend a service or business to another person.
To find out how satisfied employees are with HR’s services, you can measure the NPS of HR.
Using the Net Promotor Score, you can also measure to what degree people recommend working for the organization – employee net promoter score (eNPS). The NPS can be a solid HR KPI, depending on your strategic goals.
Manager effectiveness (index)
Various metrics can contribute to tracking manager effectiveness, including:
- Turnover and retention per manager
- Engagement scores per manager
- Team performance metrics
- Absenteeism per manager
How a company measures the effectiveness of its managers will depend on the organization’s goals. Doing so helps it assess the impact of managers on, among other things, team satisfaction and productivity.
Percentage of cost of the workforce
This metric measures the proportion of an organization’s total expenses that is allocated to workforce costs, calculated by dividing workforce expenses by the organization’s total costs.
While not commonly used, this KPI can be valuable for identifying opportunities to reduce costs or evaluate the potential benefits of automation in streamlining operations.
Quality of hire
Put simply, quality of hire represents the value a new hire brings to a company. It indicates how much a new employee contributes to an organization’s long-term success.
The quality of hire demonstrates how effective HR is in recruiting and selecting candidates. Consistently maintaining a high quality of hire enables the organization to reach its strategic goals more easily.
Turnover rate
Turnover is a common metric and an important KPI since high turnover can be very costly. Calculating employee turnover, however, is much trickier than it may seem. For an in-depth overview, you can check out our article about how to calculate employee turnover rate, in which we discuss various approaches and propose a best practice.
Involuntary turnover rate
Not all turnover is voluntary. Involuntary turnover refers to the percentage of employees who leave the organization due to employer-led decisions, such as layoffs, terminations, or redundancies. This can be calculated as a percentage of either the total number of employee departures or relative to the total number of employees in the organization during the same period.
Voluntary turnover rate
This is the number of employee-led departures. Again, you can consider it as a percentage of the total separations or in relation to the total number of employees.
Unwanted turnover rate
Not all turnover is bad. It is usually positive when bad performers or actively disengaged people leave the organization. Unwanted turnover occurs when good or high-performing employees leave the company for reasons that could have been avoided (i.e., compensation, management, lack of development opportunities, etc.).
Training effectiveness
The training effectiveness evaluates how well a training program achieves its objectives by measuring its impact on employees’ skills, knowledge, and job performance, as well as its contribution to the company’s financial results. Effective training should deliver measurable improvements in these areas to justify its value.
Training ROI (Return on Investment)
As the name suggests, training ROI assesses how much a company gains financially from its investment in training programs by comparing the benefits (e.g., increased productivity) to the training costs. To calculate training ROI, subtract the total cost of the training from the net benefits gained, then divide that result by the total training cost.
90-day quit rate
This refers to the number of new hires that leave the company within three months (or a year if you opt for the 360-day quit rate). It is part of HR’s role to ensure that the right people are hired. Failing to do so will have a measurable, negative impact on the organization’s effectiveness.
HR KPIs vs. metrics
Every KPI is a metric, but not every metric is a KPI. That’s the main difference between the two. The table below gives a brief overview of HR KPIs and HR metrics.
Focus
Contributing to achieving organizational goals
Providing a wider view of HR operations and activities
Decision-making
Used for data-driven, strategic decisions
Used for deliberate adjustments of HR practices
Specificity
Tend to be SMART
Tend to (also) include more general data points
Examples of what HR KPIs are not include:
- Average length of service/tenure
- Average salary
- Average interviewing cost
- Average number of vacation days per employee
- Average number of training hours per employee
- HR-to-FTE ratio
- Employee training satisfaction.
These aren’t KPIs because they tell us nothing about effectiveness. For example, do we need 1 HR staff member per 100 employees or 1.5? Measuring the HR-to-FTE ratio alone doesn’t answer that question.
Put simply, HR KPIs are not just average employee data. They are measurable metrics directly linked to the organization’s strategic goals.
Characteristics of good HR KPIs
As we’ve already mentioned, good HR KPIs are unique to the organization and its goals. Let’s explore two frameworks that you can use to shape and set KPIs that help you track your progress towards these goals.
Eckerson’s KPI framework
In a 2009 paper, Wayne W. Eckerson described several characteristics of “good” KPIs. These can be applied to creating KPIs in HR as well:
- Sparse: You should only focus on a few HR KPIs. After all, they are called key performance indicators for a reason. Focus on the essential ones for your organization and leave the rest out. The general rule remains the fewer, the better.
- Drillable: You should be able to drill into detail. Why aren’t we meeting our recruitment cost target? What groups are the costliest to recruit? By drilling down, you can predict your future success more easily and see where progress is lacking.
- Simple: Users, including people from outside the HR department, need to understand the KPI. If it’s not simple, it is hard to communicate and focus on.
- Actionable: HR only focuses on KPIs related to HR outcomes because they can influence these. HR is not responsible for revenue or sales success. Only focus on the KPIs that you can affect.
- Owner: In line with the previous characteristics, KPIs need to have an owner. The owner is rewarded in case of success and is held accountable if the target isn’t hit. The owner of an HR KPI typically is a senior member of the management team, like a department leader or manager.
- Correlated: The KPI should be related to the desired outcome. When we speak about business targets, the HR KPIs need to be related to these business outcomes. Griffin (2004) states that there should be a direct link from KPI to goals, from goals to objectives, and from objectives to strategy.
- Aligned: We briefly touched on the alignment of HR KPIs earlier. KPIs shouldn’t undermine each other.

SMART goals framework
Most of us are familiar with another, more straightforward framework that summarizes the above. This alternative, defined by Hursman 2010, is the well-known SMART acronym. It stands for:
There’s a simpler framework that we are all familiar with that summarizes the above. The alternative, defined by Hursman (2010), is the well-known SMART acronym. This stands for
- Specific
- Measurable
- Attainable
- Relevant
- Time-Bound.
Knowing these criteria and applying them can help you create the relevant Human Resources key performance indicators your organization needs to succeed.
Let’s look at an example of what this can look like. Take the internal promotion rate metrics. It’s a SMART KPI because it aligns with the criteria:
- Specific: It focuses on a clear outcome—tracking the percentage of employees promoted within the company.
- Measurable: The promotion rate can be quantified, making it easy to track progress over time.
- Attainable: Companies can reasonably influence this metric through internal development programs, mentorship, or succession planning.
- Relevant: It aligns with organizational goals like talent development, employee retention, and cost-saving measures by reducing external recruitment needs.
- Time-bound: The metric can be tracked over a specific period, such as monthly, quarterly, or annually, to evaluate trends and improvements.
This KPI highlights both employee growth and organizational efficiency, making it a valuable tool for tracking HR and business success.
An example of something that is not a SMART KPI is the average length of service. While it is simple to measure and attain, it lacks relevance and is not time-bound. The duration of an employee’s tenure doesn’t provide insight into their efficiency, productivity, or contribution to innovation, nor does it directly connect to the organization’s goals or priorities.
Leading vs. lagging KPIs
Key performance indicators can be leading or lagging. Kaplan and Norton (2007), the researchers who developed the Balanced Scorecard, explain the difference in their paper.
Leading indicators are forward-looking and focus on causes or predictors of future events. They help anticipate outcomes. For example, productivity is a leading KPI for labor costs, as higher productivity can lower labor costs in the future.
Lagging indicators look backward and measure the results of past actions or developments. They reflect outcomes already achieved. For instance, if productivity is a leading KPI, sickness rate could be a lagging KPI, as it shows the effect of productivity-related efforts. Another example of a lagging KPI might be labor cost per employee.
Here’s an example: Let’s say the business goal is to enhance employee qualifications. This is relevant, especially in industries where continuous training is critical. In that case, a leading indicator could be time to proficiency—how quickly employees complete training and begin applying their skills. This predicts improvements in productivity and innovation.
A lagging indicator could be the percentage of employees who completed the qualification, showing the final outcome of training efforts.
As you may notice, leading indicators are often less precise but offer interesting insights into a KPI’s ongoing performance and potential outcomes. Lagging indicators, on the other hand, are more precise, but only after the fact.
Using both types of KPIs helps build a well-rounded HR scorecard that tracks past achievements and forecasts future performance.
HR KPIs case study
As mentioned above, not all metrics are KPIs, and not all KPIs will assist in understanding HR performance. Let’s look at how a company in the maritime sector sets its HR KPIs for its recruitment department.
The Western maritime sector is in difficult waters. Fifty years ago, most ships were built in their home country; today, building large cargo ships and tankers in East Asia is much cheaper.
For the U.S.-based shipbuilding company in our HR KPIs case study, competing with cheap labor and steel from China was difficult. Therefore, a cost-differentiation strategy was not an option. The company decided to invest heavily in technology and innovation, knowing that most of its current client portfolio was interested in their high-tech shipbuilding skills (mostly smaller vessels) at a much higher price point.
As strategic goals don’t happen in isolation, the U.S. company had to cut costs while becoming more innovative through smarter hiring. This meant that:
- They had to decrease their recruitment costs
- They needed to hire more qualified professionals.
The image below shows what their recruitment strategy map looked like. The arrows indicate the internal relationships between the company’s different goals. The executive board decided on the strategic objectives, and based on those, HR established the HR goals.

To implement these goals, the company created specific KPIs. For example, they measured the reduction in lead time and evaluated their attractiveness as an employer. Once the KPIs were established, they assessed their current performance levels and set targets for improvement.
The resulting HR KPI framework outlined clear metrics aligned with their strategic goals, enabling the company to track progress and adjust strategies as needed.

HR KPI template
An HR KPI template is an excellent tool for monitoring key performance metrics in HR. It enables Human Resources teams to:
- Align their HR initiatives and activities with the company’s goals
- Measure the success of these initiatives over time
- Strive for continuous improvement.
To help you get started, we have created a free, downloadable HR KPI template in Excel that is easy to customize:

HR KPI best practices
Let’s explore some best practices for implementing and tracking HR KPIs, for example:
- Set KPIs based on organizational goals: As highlighted throughout this article, you need to define KPIs that align directly with the organization’s strategic objectives, focusing on outcomes that drive business success. For example, a company aiming to improve productivity might track KPIs like time to proficiency for new hires or task completion rate.
- Leverage people analytics and KPI dashboards: Apply analytics tools like Excel or your HRIS analytics capabilities to connect data points such as recruitment costs, employee satisfaction, and demographics for actionable insights. Create an HR dashboard with your most important KPIs to keep track of and provide a handy overview.
- Empower your HR team: Provide your HR team with the tools, training, and authority to effectively track, analyze, and act on KPI data. This includes investing in people analytics platforms, fostering a data-driven culture, and encouraging proactive decision-making based on insights.
- Secure executive sponsorship: Engage organizational leaders to support HR initiatives by demonstrating how these efforts contribute to achieving key business objectives and improving overall performance. Ensure leadership understands the value of aligning HR strategies with measurable outcomes.
- Track performance over time: Regularly analyze how you perform on your KPIs and other HR metrics to identify patterns and adjust strategies accordingly.
A final word
HR KPIs are an excellent way for HR to contribute to the overall organizational strategy, providing measurable benchmarks to assess how HR contributes to business success. They not only track progress but also create a clear link between HR activities and the company’s broader objectives, such as improving productivity, enhancing employee satisfaction, or reducing costs.
Setting them, however, requires a thorough understanding of the company’s strategy and goals. This means HR must collaborate closely with leadership to identify key business drivers and determine how HR can support them.
FAQ
HR KPIs are strategic HR metrics measuring how well HR is contributing to the overall achievement of the organization’s goals. They are different from one company to another. Examples include employee productivity rate, internal promotion rate, NPS, and quality of hire (among many others).
The KPIs in an HR scorecard will vary from one company to another. Examples are recruitment cost (in dollars, for example) and the satisfaction score of the manager after one year (quality of hire).
A leading indicator in HR is a forward-looking metric that predicts future outcomes by focusing on activities or behaviors that precede those results. For example, time to fill open positions forecasts the organization’s ability to meet staffing needs, while employee engagement survey scores anticipate future retention and performance trends.
The post HR KPIs: Guide, 20 Examples & Free Template appeared first on AIHR.
]]>The post HR Dashboard: 5 Examples, Metrics and a How-To appeared first on AIHR.
]]>In this article, we explore the intricacies of the HR dashboard. We compare it to the HR report, examine key functions and metrics, and discuss how to build an effective dashboard. We also share some examples. Let’s dive in!
Contents
What is an HR dashboard?
HR dashboard vs HR report
Key functions of an HR dashboard
HR dashboard metrics
Best HR dashboard tools
How to create an effective HR dashboard
HR reporting pitfalls to avoid
HR dashboard examples
Headcount dashboard in Excel: Template
How to read an HR dashboard
FAQ
What is an HR dashboard?
An HR dashboard is a tool that provides HR teams with a visual overview of the most important HR metrics and KPIs in one place. It aggregates and displays information in a user-friendly format, often using graphs, charts, and tables. An HR dashboard gives an overview of the state of the workforce and it is key to strategic decision-making in HR.
HR dashboards typically include metrics related to recruitment, employee performance, turnover rates, absenteeism, training and development, employee engagement, and workforce diversity. Advanced dashboards may integrate real-time data and predictive analytics to forecast future HR needs or challenges.
HR teams can use various tools to create an HR dashboard, including Excel, Tableau, PowerBI, or their HRIS. Modern, interactive dashboards allow HR teams to gather and combine data from different HR and business systems and analyze this data without having to switch between tools.
HR dashboard vs. HR report
Both HR dashboards and HR reports focus on data and metrics to inform decision-making, but they differ significantly in terms of format, purpose, and functionality.
HR dashboards are highly visual, aiming to provide insights at a glance and enable ongoing monitoring of key metrics and trends. HR reports are typically text-heavy and often structured with tables and descriptive summaries. They’re intended for detailed analysis, documentation, and deeper explanations of data.
While HR dashboards are meant to be accessed for routine monitoring and decision-making, HR reports are often generated periodically (e.g., monthly, quarterly) for review or compliance purposes.
There are different types of HR reports, such as:
- Headcount reports
- Monthly HR reports
- Annual HR reports
- Turnover and retention reports
- Health and safety reports.
Both the HR dashboard and the HR report have their place in an HR strategy, allowing for high-level monitoring (dashboards) and detailed evaluation (reports).
For example, an HR dashboard might display a real-time view of employee turnover trends using an interactive chart that updates automatically. Meanwhile, an HR report might provide a detailed analysis of turnover data for the past quarter, including narrative insights and static tables.
Learn how to create effective HR dashboards
Build the skills to design and use HR dashboards that simplify data analysis, highlight trends, and support better decision-making.
AIHR’s self-paced HR Metrics and Dashboarding Certificate Program focuses on practical techniques to track key HR metrics, create clear visual reports, and communicate insights effectively.
Whether you’re new to HR analytics or want to enhance your existing skills, this program will help you make a measurable impact in your organization.
Key functions of an HR dashboard
The HR dashboard plays a big part in enabling HR to track workforce data and report on it. The tool has several key functions, including:
- HR monitoring: Tracking key workforce metrics and regular reporting enables HR to keep a finger on the organization’s pulse. They can spot new trends and opportunities early on and address emerging problems before they significantly impact the business.
- Management information: An actively monitored and managed HR dashboard – and the reports that derive from it – can help managers do their jobs better. A well-structured and easily digestible report can inform managers about relevant team and department developments.
For example, suppose the customer support department struggles with high turnover and a high time to hire. In that case, managers will be more likely to emphasize retaining employees and be more aware of risks like longer replacement times when someone is about to leave. - Track problem areas: An HR dashboard is also a great way to track key problem areas transparently. Transparency in turnover rates per manager will encourage them to pay closer attention to retaining employees because their own reputation is on the line. By tracking areas of concern, HR can leverage its position to drive improvements.
- Strategic decision-making: Monitoring and analyzing data over time naturally gives HR teams insights into developing trends, budding issues, and more. This, in turn, allows them to make more strategic and data-driven decisions that align with the organization’s business goals and contribute to its success.
- Better communication: A well-designed HR dashboard that tracks data in real-time provides HR professionals with a wealth of information. The HR reports generated based on the dashboard data allow them to back up their ideas or initiatives with actual company data and hence improve their communication with the organization’s leadership and stakeholders.
HR dashboard metrics
A general HR dashboard should track metrics related to the workforce demographics and costs. Specialized dashboards might provide insights into specific areas like diversity, recruitment, and employee performance.
Here are some common metrics to showcase on an HR dashboard:
- Tenure: This metric measures the length of time employees stay with an organization. Tracking employee tenure can help identify trends in employee loyalty and engagement, and it provides valuable insights for workforce planning and retention strategies.
- Gender: A common distinction to drill into diversity data.
- Age: Age is becoming increasingly important in today’s multigenerational workforce. Age is also important for strategic workforce planning and succession planning, and it is often a key focus point for organizations that want to innovate and reorganize.
- Education level: Educational levels should only be included when available and when relevant to the organization’s overarching goals. Otherwise, they risk being a ‘vanity metric’ in the HR reporting.
- Function type: A metric like function type or function clusters might help to distinguish different groups within the company. Examples include top management, middle management, and individual contributors.
- FTE: A Full-Time Equivalent is the hours worked by one employee full-time. The number of FTEs is often lower than the number of total employees. This is especially true if there are many part-time workers present in the organization. FTE provides an accurate measure of the total workload in the organization. People who work less than 1 FTE can be considered part-time workers.
- Employees active: This metric represents the number of employees working at the organization.
- Turnover: This metric represents the number or percentage of employees who left in the previous period.
- New hires: This metric represents the number or percentage of new employees who joined the organization within the last year.
- Absenteeism rate: This metric represents the average percentage of time that employees were absent in the previous period. Another representation of this number is the total days of absence per employee.
- Cost of absence: This metric is not a standard one, but it can make the previously mentioned absence rate more tangible by relating it to a financial number.
- Cost of labor: Labor cost is the total amount that an organization pays to its workforce. This number includes employee benefits and payroll taxes. The cost of labor can be divided into direct and indirect costs. Direct costs are the labor costs associated with people who contribute to the primary process (an assembly line worker, for instance). Indirect costs cannot be traced back to a specific level of production (a security guard guarding the factory, for example).
- Training cost: Training cost represents the total amount a company spends on training new hires and the existing workforce.
- Recruitment cost: This is the total cost of recruitment efforts. Typically, it includes the costs of external agencies, job advertisements, and, sometimes, lost productivity. The cost of recruitment is much more complex, though, as it also involves elements like the cost of management time in selection and training. All these components help calculate the cost per hire.
- Time to fill: This metric refers to the number of days between a position opening up and a candidate accepting that position. It will vary significantly between job types: software developers, big data analysts, and highly qualified salespeople are much harder to find than entry-level marketers, for example.
Bear in mind that this is by no means an exhaustive list. The metrics you’ll track on your HR dashboard will depend on your organization’s specific goals, priorities, and challenges, as well as the dashboard’s audience.
For example, senior executives may prioritize high-level metrics like turnover rates, headcount trends, and workforce costs, while HR managers may focus on more operational metrics such as time to hire, training completion rates, and absenteeism.
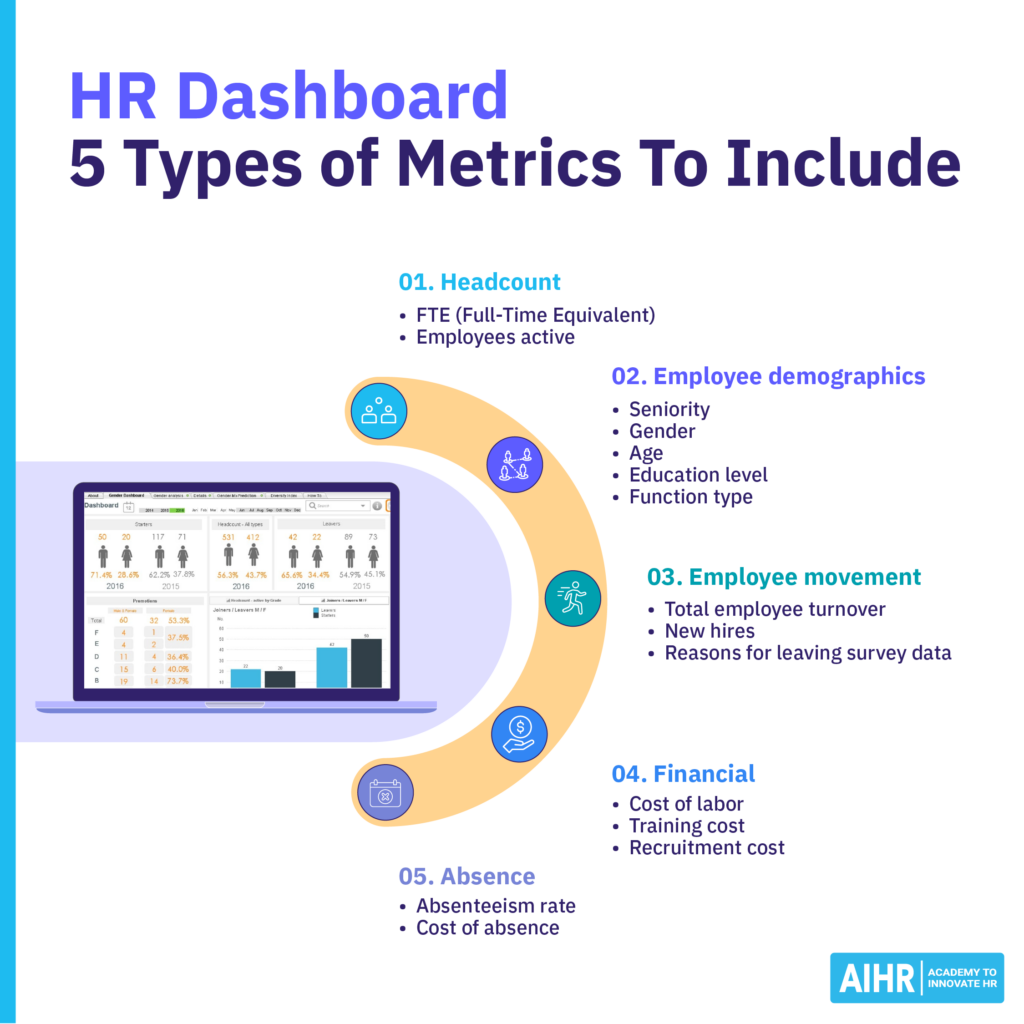
Best HR dashboard tools
To get the most out of an HR dashboard, it is important to choose a tool that fits your organization’s needs and your current HR tech stack. Let’s take a look at some common HR dashboard tools and their advantages and drawbacks.
Excel
It is fairly easy to create a basic HR dashboard in Excel. You can use a pre-created HR dashboard template directly in Excel or create tables and charts with the relevant HR data yourself.
Benefits and drawbacks
The biggest benefit of using Excel for your HR dashboard is the fact that Excel is (relatively) familiar to many people and is usually readily available.
But Excel has drawbacks, too. Its visualization, collaboration, and real-time data management capacities are limited, for example. Spreadsheets also don’t offer the best data protection, which can lead to all sorts of security risks.
Tableau
Tableau’s HR dashboard software offers People Teams many ways to visualize their HR data, including motion charts, boxplots, pie charts, bullet charts, and more.
Benefits and drawbacks
The most obvious benefits of Tableau are its top-of-the-line data visualization features and, as a result, the fact that the software allows HR teams to showcase their data in a way that works for them.
The other side of this is that the platform is more complex, which means that you will likely need at least one person on the team who knows (or is willing to learn) how to work with Tableau.
Power BI
Microsoft’s Power BI is another tool that makes creating an HR dashboard and the subsequent aggregation, analysis, and visualization of data and reports very simple.
Benefits and drawbacks
Since Power BI is a Microsoft product, integration with other Microsoft products such as Excel, SharePoint, and Azure is easy. This can be an important benefit as many businesses work with Microsoft products. Other advantages include the fact that it’s easy to use, offers real-time data processing, and is secure.
As with any platform, there are also a couple of potential disadvantages of working with Power BI. The software is online-only, has limited customization options, and a rather steep learning curve for those who are unfamiliar with it.
Asana
Asana is a task and project management platform. Its dashboard capabilities enable People Teams to use pre-built dashboard templates or to create custom ones for their HR processes.
Benefits and drawbacks
Asana’s software offers some interesting collaboration features. HR stakeholders and others involved can engage in discussions, co-edit dashboards, and leave comments, making it a good option for People Teams that need a collaborative dashboard tool.
Disadvantages may include the fact that Asana doesn’t offer phone support and is relatively expensive.
HR tip
You might also want to look into dedicated HR dashboard platforms like Visier and Charthop. Such tools offer specialized features designed for HR needs, like advanced analytics, customizable reporting, and integration with existing HR systems.
5. Google Data Studio (Looker Studio)
Google Data Studio—now called Looker Studio—is a free tool from Google that helps you turn HR data into interactive dashboards and reports.
Benefits and drawbacks
The biggest benefit of Looker Studio is that it’s free to use and works well with other Google tools like Google Sheets, BigQuery, and Google Analytics. It’s a good option if your HR data lives in spreadsheets or cloud databases. The platform lets you create interactive dashboards that update in real-time and are easy to share with others.
The drawbacks include limited design options and fewer built-in templates compared to paid tools. While it’s simpler than more advanced platforms, building a solid dashboard still takes some time and understanding of how your data is set up. It may also not be the best choice if you need complex analytics or large-scale reporting.

An HR dashboard is the most efficient way for HR teams to monitor, manage, track, and report on their HR KPIs (key performance indicators).
Here’s what to consider when creating an HR dashboard:
- Choose the right tool: The ideal tool for one organization might not be the right option for another. Factors to consider here include:
- The features you need (i.e., collaboration, visualization, etc.)
- Vendor support
- Whether the tool is easy to use or if you need a dedicated person who has experience with it
- The available budget.
- Select critical metrics for your dashboard: Here, too, the key metrics for your HR dashboard depend on what kind of dashboard you want to create; they won’t be the same for a recruitment dashboard and an employee performance dashboard, for example. If it is a ‘generic’ one, some of the HR dashboard metrics mentioned earlier in this article may be useful.
- Focus on user-friendliness: HR dashboards should be easy to maintain and use to ensure they deliver value to the organization without creating unnecessary complexity or administrative burden. Focus on providing quick access to key metrics without overwhelming users.
- Prioritize accuracy: HR reporting is often seen as a hygiene factor. This means that, like hygiene, solid and accurate reporting is taken for granted and not fully appreciated. Imagine you’re out for a meal in a restaurant. You’re not likely to comment on the restaurant being clean; this is something we simply expect. But, if you get dirty cutlery or the toilets are messy, you complain. To relate this to HR, reporting is not noticed much unless errors occur. Solid reporting, like cleanliness in a restaurant, is essential in maintaining credibility.
- Customize for stakeholders: If other stakeholders outside the HR department also require (regular) access to certain HR dashboards, you may want to involve them in the creation of those dashboards. What metrics do they believe are important, and how would they like to work with and use the dashboard?
HR reporting pitfalls to avoid
There are several pitfalls concerning HR reporting. It is important to address these, as doing so will prevent you from getting trapped in a never-ending reporting cycle.
- Avoid generating your reports manually: This is highly inefficient and will drain the capacity of your HR data department or person. See how you can automate your HR reporting, for example, by using HR software tools that integrate with your existing systems to pull and analyze data automatically.
- Don’t try to please everyone: If you can make 80% of the people happy with 20% of the information, that may be the best solution. Making an overly complicated dashboard and reporting on irrelevant data may lead to low engagement with the reports or dashboards and thus decrease their impact.
- Don’t ignore data errors: HR data will contain human errors. No matter how efficient your software, processes, and people are, there will be mistakes. When mistakes occur, fix them in the source systems. Make sure to create procedures to check accuracy when inputting data.
HR dashboard examples
HR dashboards come in different shapes and forms. Here are a couple of examples of HR dashboards in action.
General HR dashboard
This HR dashboard provides a snapshot of workforce data, highlighting headcount distribution by grade, hiring trends, and employee movement by year.
Key metrics such as top talent and performers, recruitment costs, and promotions are displayed, along with turnover breakdowns (regretted and non-regretted).

Sickness & absence HR dashboard
This HR metrics dashboard focuses on absence information, and the tab displayed in the image below revolves around sickness in particular. It visualizes the average number of sick days taken per employee over the past year and their cost.

Headcount dashboard in Excel
This Excel dashboard helps HR teams easily monitor workforce trends and patterns.

Recruitment dashboard
This recruitment dashboard example distinguishes between the company’s technical and non-technical hires. The dashboard provides real-time updates as we see the organization’s current hiring pipeline. It also includes the company’s top hiring sources for various departments.

General HRIS dashboard
This HRIS report is part of AIHR’s People Analytics Certificate Program, in which you can learn how to create this exact report by connecting multiple datasets using Power BI. The report is fully interactive.
If you’re new to Power BI, you can also watch this guide on using the tool to create interactive HR dashboards:
How to read an HR dashboard
Once you’re looking at the dashboard, the next step is knowing how to interpret what’s in front of you. The data may seem simple, but each metric has a story behind it. Here’s how to read the most common ones and what to take away from them.
Employee headcount
The size and structure of your workforce
How your organization is growing, how teams are built, and where people are placed
Total leave
Time taken off across vacation, sick leave, and other types
How employees are using their time off and where you might need better coverage planning
Application response rate
The percentage of job applications that get a response within a set time
How smooth your candidate experience is and how quickly your team follows up
Performance
Evaluation scores and goal progress
Who’s excelling, where growth is needed, and where to invest in development
HR projects summary
Status of current HR initiatives
What HR is focusing on and how well those projects are being delivered
Total salary
Your overall payroll spend
How your compensation budget is being used and whether pay is balanced and fair

A final word
Whether it’s employee turnover, employee safety, or any other workforce-related topic, HR dashboards are a great way for People Teams and other stakeholders in the organization to get a picture of what’s going on. While they might take some time to set up, they can save countless hours in the long run by consolidating key data into one easily accessible place.
With clear visuals and real-time insights, dashboards help teams identify trends, address issues proactively, and make informed decisions. Plus, they foster transparency by ensuring everyone has the same understanding of workforce metrics.
FAQ
An HR dashboard is a tool that helps HR professionals visualize, track, evaluate, and report on their various HR metrics and KPIs. It is an integral part of HR management and key to making informed decisions.
It is relatively easy to make a basic HR dashboard in Excel. Create a Table (‘Insert,’ Table’) with the relevant HR data. Open a new worksheet and add slicers (‘insert,’ ‘Slicer’) for the HR metrics you want in your dashboard. Arrange the slicers to create your dashboard.
Depending on the tool you use, there are different ways to build an HR dashboard. Some tools have pre-built HR dashboard templates you can use and customize, for example. When creating an HR dashboard, it is good to keep in mind what metrics you want to include, its ease of use, and potential stakeholder requirements.
The post HR Dashboard: 5 Examples, Metrics and a How-To appeared first on AIHR.
]]>The post 23 Employee Performance Metrics To Track appeared first on AIHR.
]]>These insights help identify areas for improvement, highlight top performers, and guide decisions on training, promotions, and resource allocation. By analyzing performance metrics, organizations can support employee development and ensure their efforts align with business goals.
Let’s take a look at 23 employee performance metrics that you should track. For a broader perspective on HR metrics beyond performance, check out our 51 HR Metrics Cheat Sheet for deeper insights across various HR functions.
Contents
What are employee performance metrics?
Employee performance metrics examples
– Work quality metrics
– Work quantity metrics
– Work efficiency metrics
– Organizational performance metrics
How to implement employee performance metrics
What are employee performance metrics?
Employee performance metrics are quantifiable indicators used to evaluate and measure an employee’s effectiveness, efficiency, and contributions to organizational goals. These metrics provide a standardized way to assess individual or team performance, align efforts with strategic objectives, and identify areas for development or improvement.
To summarize, employee performance metrics are critical for:
- Identifying high performers and areas needing improvement
- Supporting data-driven decisions in promotions, training, or disciplinary actions
- Enhancing transparency and accountability within teams
- Aligning individual performance with organizational success.
Employee performance metrics examples
There are various types of performance metrics focused on work quality, quantity, efficiency, and organizational performance, each designed to measure different aspects of employee performance.

Let’s look at performance measures you can track at your organization.
Work quality metrics
Work quality metrics reflect the quality of an employee’s performance. The most commonly used metric is a subjective appraisal by their direct manager, but there are also other ways to assess work quality.
1. Management by objectives
A way to structure a manager’s subjective appraisal is to use management by objectives (MBO). MBO is a management model that aims to improve an organization’s performance by translating organizational goals into specific individual goals. These goals often take the form of objectives set by the employee and the manager.
The employee works towards these goals and reports back to the manager on their progress. These goals can even be given a certain weight (a number of points). On successful completion of these goals, points are awarded to the employee. In turn, managers can make goals more tangible and performance reviews more data-driven.
2. Subjective appraisal by manager
In most companies, employee performance evaluation happens twice a year in performance reviews. Employees are assessed on several criteria, the quality of their work being the most common.
Assessing the quality of an employee’s work offers key insights into their strengths and areas for growth. This becomes even more impactful when paired with a tool called 9 box grid. The 9-box grid is based on a 3×3 table matrix that helps evaluate employees based on their performance and potential. For example, employees with high performance but low potential are perfect for their current function.
Employees in the top right corner, those who score high on both performance and potential, are often designated to quickly advance through the organizational ranks as they can add more value higher up the ladder.
This 9 box grid is an easy way to assess the current and future value of employees and is a helpful tool for succession management (i.e., you want to promote your high potential).

3. Product defects
It is tricky to measure (production) quality objectively. An approach often used in more traditional manufacturing industries is to calculate the number of product defects per employee or per team. Defects, or incorrectly produced products, indicate low work quality and should be kept as minimal as possible.
Even though increased standardization of production processes has rendered this metric almost obsolete, the approach to measuring employee performance can be applied to other areas, like in the example provided below.
4. Number of errors
The number of input errors could act as an alternative to the previously mentioned product defects. This metric is also known as error rate. For example, software development teams could measure errors per thousand lines of code.
The same goes for the number of corrections in written work or the number of bugs in software code. Especially in computer programming, a single error can stop an entire program from working. This can have a major impact on the business, especially for companies that release new software versions weekly or monthly.
The conciseness of a piece of code is another important quality factor. If ten lines of code can produce the same computational result as 100 lines of code, the former is an indication of better quality.
5. Net promoter score
Net promoter score (NPS) can be an indicator of employee performance. NPS is a number (usually between 1 and 10) that represents the willingness of a client to recommend a company’s service to other potential clients. Clients who score a 9 or 10 are likely to be highly satisfied and will act as promoters for the company. This score is used regularly to assess sales employees, e.g., in car sales, where it is included in the final form customers need to sign.
The advantage of NPS is its simplicity. The disadvantage is that it is not uncommon for employees to instruct customers to give a certain rating (i.e., 9 or 10).
Develop your performance management skills
Learn how to use employee performance metrics to develop high-performing teams and contribute to organizational success.
AIHR’s High-Impact Performance Management Online Course equips you with skills to manage performance effectively, address underperformance early on, and deliver measurable impact.
6. Customer Satisfaction Score (CSAT)
Customer Satisfaction Score (CSAT) evaluates an employee’s performance by measuring the satisfaction of customers they interact with, typically derived from feedback on specific interactions, services, or support provided.
Customers rate their satisfaction with the service or support that an employee provides, often on a scale (e.g., 1 to 5 or 1 to 10). Scores from individual interactions are aggregated to assess the employee’s contribution to overall customer satisfaction. This metric provides tangible, customer-based data for evaluating and improving employee performance.
7. 360-degree feedback
360-degree feedback is another tool to measure employee performance. To assess an employee’s score, their peers, subordinates, customers, and managers are asked to provide feedback on specific topics. This feedback often represents an accurate and multi-perspective view of an employee’s performance, skill level, and points of improvement.
8. 180-degree feedback
180-degree feedback is a simpler version of the 360-degree feedback tool. In the 180-degree feedback system, the feedback typically comes from the direct manager and the employee’s self-assessment.
Unlike 360-degree feedback, which incorporates perspectives from multiple sources, this method hones in on how the employee views their work and how it aligns with their manager’s assessment, offering a more focused and straightforward evaluation process.
9. Forced ranking
Forced ranking, also called the vitality curve or stack ranking, is a way of ranking employees by asking managers to make a list of their best to their worst employees. This way, all the firm’s employees are compared with each other and evaluated on their performance.
The goal of this method is for a company to improve its workforce by firing the bottom 10% and replacing them with top applicants from its talent pool. Research shows that this can lead to a significant improvement in workforce potential in the right companies.
However, this “rank and yank” approach has been widely criticized, and most companies stopped using it, including General Electric, whose then-CEO Jack Welch popularized the practice.
Work quantity metrics
As quantity is often easier to measure than quality, there are multiple ways to measure this employee KPI. The metrics used to judge quantity will vary between industries. Some jobs are more difficult to quantify or don’t fit well with traditional output-based measures.
For instance, in healthcare, hospitals in many countries operate under government-imposed caps on the number of beds available. This means that doctors and nurses cannot be evaluated based on how many patients they admit, as they have no control over the cap. Instead, a more meaningful metric might be the average number of days patients spend in beds, as it reflects efficiency and care quality within the constraints of the system.
10. Number of sales
The number of sales is a straightforward way to pinpoint a sales employee’s output, particularly in roles involving “simple sales”. This holds especially true with ‘simple sales’. For instance, in a retail environment, sales associates may be evaluated by how many items they sell in a shift. In these cases, under similar conditions, the most skilled employees will consistently sell the most within a set timeframe. This is a clear example of an outcome metric.
However, for more complex sales, such as those involving longer sales cycles—like selling real estate or enterprise software—the number of sales alone becomes less reliable. In these cases, factors like the lower frequency of sales and the role of chance or timing can significantly affect outcomes, making it harder to measure performance purely by the volume of sales.
That’s why complex sales cycles, like software solution sales (which can have a sales cycle of up to 1.5 years), are best measured by other metrics. These are so-called process metrics, as they represent the actions one needs to do to increase the chance of a successful sale. For example, the person who calls the most customers has, in the end, the best shot at making a successful sale. In this case, the number of phone calls would be a more reliable metric of long-term sales success.
Examples of employee performance metrics focused on sales performance include:
11. Number of (potential) client contacts added to the customer relationship management (CRM) system
12. Number of outbound sales calls made
13. Number of on-site client meetings conducted
14. Number of active leads
Of course, different industries have different ways of expressing their quantitative output, tailoring metrics to reflect the specific actions and results that drive success in their field.
15. Number of units produced
In traditional manufacturing, the number of units produced was often a reliable quantitative metric. Similar metrics are still used in modern (service) organizations. For example, companies with employees in data entry roles sometimes monitor keystrokes per minute to ensure efficiency. Another way to measure quantitative production is to track the number of lines of code that programmers produce.
There are some obvious disadvantages to using a purely quantitative production metric. As in the previous example, such an output metric should be used only when one’s output is very simple and straightforward. For instance, warehouse operations employees could be evaluated based on the number of packages picked, packed, or shipped in an hour. For routine tasks like these, where the process is straightforward and efficiency is the primary focus, a purely quantitative metric like this can be an effective way to measure productivity.
16. Handling time, first-call resolution, and contact quality
Contact centers are one of the most employee performance metrics-driven places. Common metrics include average handling time, which is the average time the customer is on the phone, including when they are on hold, and first-call resolution, which is the number of callers whose problem is resolved the first time they called.
Others include contact quality, which is the rating a customer can give on the call, and service level, which measures how many calls are answered at what time (e.g., 90% of calls are answered in 25 seconds).
17. Task completion rate
Task completion rate measures the percentage of tasks successfully completed by an employee within a given timeframe relative to the total number of assigned tasks.
It reflects the employee’s ability to manage and finish assigned responsibilities. A high task completion rate indicates effective performance, while a low rate may signal challenges such as workload issues, time management difficulties, or skills gaps.
Work efficiency metrics
The difficulty of both qualitative and quantitative employee performance metrics is that they do not say much on their own. When a programmer writes 40 lines of code an hour, they produce a lot of code, but that says nothing about the code’s quality.
There should always be a balance between quantity and quality. That’s where the next metric on the list comes in.
18. Work efficiency
This metric evaluates how effectively resources—such as time, money, or effort—are utilized to achieve a certain level of output while maintaining quality.
It’s difficult to assess fairly the balance between the quantity and quality of work, which is why many organizations struggle with accurately evaluating employees during performance reviews. In fact, companies like Deloitte, GE, and Adobe scrapped performance reviews mainly because of this.
That said, having reliable performance data remains invaluable. It enables organizations to make informed decisions and better predict an employee’s future contributions, even if traditional review processes are evolving or being replaced.
Organization-level metrics
Organizations can also use employee performance metrics to assess their own competitiveness. These metrics are generally used to assess the efficiency of an entire workforce rather than individual employees.
19. Revenue per employee
Revenue per employee measures the average amount of revenue generated by each employee, calculated by dividing the total revenue of the organization by the number of employees.
Revenue per employee = Total revenue / Number of employees
A similar metric is revenue per FTE (full-time equivalent). While the revenue per employee metric uses the total headcount, regardless of whether employees are full-time, part-time, or temporary, revenue per FTE adjusts the workforce count to reflect the equivalent of full-time employment. It converts part-time and temporary employees into fractions of a full-time workload for more precise measurement.
These metrics can also be used to benchmark against other companies. Here’s recent data on revenue per employee of big tech companies:
Netflix
$2,492,969
Apple
$2,348,171
Meta (Facebook)
$1,630,541
Alphabet (Google)
$1,486,853
Uber
$1,032,012
Nvidia
$1,029,546
Microsoft
$939,321
In his book Exponential Organizations, Salim Ismail often refers to this metric. According to the author, linear organizations have a linear function of employees and profit, while exponential organizations have an exponential function of employees and profit. That’s one of the reasons why these organizations grow much faster.
20. Profit per FTE
Profit per FTE is a similar metric to revenue per employee but focuses on profit instead of revenue. A company’s profit is its total revenue minus expenses. A high profit per employee is a solid metric of an organization’s financial healthiness. It’s calculated as follows:
Profit per FTE = Total profit / FTE
21. Human capital ROI
The human capital ROI is a performance metric that assesses the value of human capital (i.e., knowledge, habits, and social and personal attributes). It is calculated by calculating the company’s revenue (minus operating expenses and compensation and benefit cost) and dividing this number by the total compensation and benefit cost that the company pays its employees.
This approach is popularized by Jac Fitz-enz in his book The ROI of Human Capital. However, his approach to measuring human capital is far from reliable and subject to major changes. At AIHR, we studied his book and tried to calculate the ROI metrics for a number of major companies in the Netherlands. The results were disappointing, as the metrics failed to take important factors into account, like layoffs, incidental cost, and other non-recurring events.
22. Absenteeism rate
Absenteeism and performance are two highly correlated constructs. Highly motivated and engaged employees generally take fewer sick days. According to Gallup’s research, the difference in absenteeism is as high as 81% between highly engaged business units and their less engaged counterparts.
Additionally, absent employees are less productive, and high absenteeism rates throughout an organization are a key indicator of lower organizational performance.
23. Overtime per employee
Overtime per employee tracks the average amount of extra hours worked by an employee beyond their regular schedule within a specific time period. It is calculated by dividing the total overtime hours worked by all employees by the total number of employees:
Overtime per FTE = Total hours of overtime / FTE
While companies may try to motivate employees with overtime pay, overall performance is likely to suffer if staff are overworked. This, in turn, is likely to contribute to lower morale and weaken retention.
How to implement employee performance metrics
Here are a couple of practical tips for HR professionals to effectively implement performance metrics for their employees:
- Align metrics with organizational goals: Ensure the performance metrics reflect the company’s strategic objectives. For example, if customer satisfaction is a priority, include metrics like CSAT scores or customer retention rates.
- Balance quantitative and qualitative metrics: Use a mix of numerical data (e.g., task completion rates, sales figures) and qualitative feedback (e.g., peer reviews, manager observations) to get a well-rounded view of performance.
- Customize metrics by role: Tailor metrics to fit specific job responsibilities. For example, for customer service roles, track resolution time and satisfaction scores, while for developers, focus on code quality and project delivery.
- Encourage collaboration in setting metrics: Involve employees and managers in designing performance metrics. This helps establish realistic, relevant metrics and fosters buy-in from the people being evaluated.
- Make metrics measurable and transparent: Use clear, objective criteria for metrics and communicate them to employees upfront. This ensures everyone understands what is being measured and how success is defined.
- Focus on development, not just accountability: Frame metrics as tools for growth rather than just evaluation. Use the insights to identify training opportunities, career development paths, and areas where employees can improve.
- Review and refine regularly: Periodically assess the relevance and effectiveness of the metrics. As business goals and roles evolve, adjust the metrics to ensure they remain aligned with current needs. Gather employee feedback to understand if the metrics feel fair and actionable.
Over to you
It’s impossible to capture an employee’s performance with just one metric. While this article provides a thorough overview, you won’t find a “one metric to rule them all” here—for a good reason: it doesn’t exist. The most effective employee key performance indicators blend qualitative and quantitative insights. Many companies approach this by using 180- or 360-degree feedback systems, where managers and colleagues evaluate an employee’s performance from multiple angles.
Organizations can take tracking employee performance a step further by integrating performance metrics with recruitment data. By comparing candidates’ profiles with their actual performance a year later, companies can identify patterns that help predict which hires are likely to become top performers. This data-driven method allows for smarter, more informed hiring decisions.
The post 23 Employee Performance Metrics To Track appeared first on AIHR.
]]>The post Job Design: A Practitioner’s Guide [2025 Edition] appeared first on AIHR.
]]>In this article, we will explore the basics of job design and HR’s role in it, plus how it can help businesses create jobs that add real value to the organization while being motivating and engaging for the employee. We also offer a proven and science-based framework that will help you design better jobs.
Contents
What is job design?
Job design theory
Job design strategies
Job design examples
Job design process: How to get started
FAQ
What is job design?
Job design is the process of structuring roles and responsibilities to enable the organization to achieve its goals while boosting employee motivation and satisfaction. This process involves determining specific tasks and their sequence and identifying the support and resources required for employees to perform effectively. A strong job design takes into account employees’ strengths and creates opportunities for skill development and growth.
Well-designed jobs lead to increased productivity and higher-quality work. They also contribute to greater job satisfaction, reduced absenteeism, and lower employee turnover. Conversely, poorly designed jobs can set employees up for failure. When individuals are pulled in too many directions without the necessary support, even high-potential employees may become frustrated, feel overwhelmed, and eventually experience burnout.

Job design vs. job redesign
- Job design focuses on structuring the components of a new job, which includes defining tasks, responsibilities, and the necessary skills, and establishing feedback and communication mechanisms.
- Job redesign, on the other hand, involves changing components of an existing job to improve, clarify, or update it. This process can help employers find skills gaps in their workforce and create targeted training programs to address this.
Both processes are essential for maintaining an effective and motivated workforce, keeping job roles relevant, and engaging in the long term.
Human Resources and job design
HR plays an essential role in job design to ensure that organizations can meet their strategic objectives and maintain a competitive edge. Effective job design helps structure roles to support the company’s goals by aligning job responsibilities with business needs.
A well-designed job framework enables organizations to attract candidates who are the right fit, supports employee development and retention, and drives performance. Through job design, HR must identify the specific skills required for various roles and continuously build a highly trained – and engaged – workforce.
Job design theory
Job design and redesign require a framework to guide the process. The best-known framework is Hackman & Oldham’s job characteristics model and theory. In 1980, Hackman & Oldham proposed that each job should have five core characteristics that motivate and challenge the individual. These characteristics remained consistent over time and are still used today.
Skill variety
The degree to which a job requires a broad range of skills. For example, a financial controller managing three different departments will have more skill variety than a controller managing one specific department. Jobs with greater skill variety are more challenging and require more competence.
Task identity
The degree to which an individual completes a whole piece of work, and how this fits into the wider goals of the organization. It’s more desirable and satisfying when a task has a clear beginning and end, and an employee is able to see the finished results of their efforts.
Task significance
The degree to which the work impacts others. When work impacts others, the task feels more meaningful, leading to higher satisfaction.
Autonomy
The level of independence and freedom an individual has. Higher levels of autonomy make a person feel more responsible for their work.
Feedback
The information that workers receive about their performance. Feedback can come from the work itself (e.g., a functioning product) and external sources (e.g., customer satisfaction).
When a job has these five characteristics, it will be more meaningful, and the employee will feel more responsible and have a greater understanding of the work results. This, in turn, leads to the outcomes we mentioned earlier: higher motivation, performance, job satisfaction, and low absenteeism and turnover. Put simply, when employees like their jobs, they are more likely to give it their all and strive for better results, which benefits both the employee and the organization.
Motivating potential score
The job characteristics model forms the basis for job design. Hackman and Oldham proposed a system called the motivating potential score (MPS). To calculate this score, one takes all core job characteristics into account and uses these to calculate the motivating potential of the job.
To do this, each of the core job dimensions should be scored on a scale of 1 (low) to 7 (high). Next, these values can be put into the formula as follows:

According to the formula, a low score on either autonomy or feedback will significantly impact the job’s motivating potential, while a lower score on skill variety, task identity, or task significance will have a less significant impact.
Job diagnostic survey
A job diagnostic survey is a tool to assess these aspects of a job. In the job diagnostic survey assessment example below, job A scores much higher on all motivational dimensions compared to job B. Because these motivational elements are multiplied, the MPS difference between the two jobs is substantial (255 vs. 40). Therefore, it would be advised to transfer some of the autonomy or feedback opportunities from job A to job B, if possible.

Other job design approaches
Job design theory (also known as motivational job design) is one of four well-known approaches to job design. Here are the other three:
- Mechanistic job design: This type of job design revolves around task specialization, the simplification of skills, and repetition, making jobs efficient and easy to train for. This approach is often used in manufacturing and assembly line roles where precision and repetition are key for productivity and consistency.
- Biological job design: This approach aims to design the physical work environment for the body and reduce physical strain on the worker. This approach to job design is common in jobs requiring physical activity or manual labor, such as warehouse work.
- Perceptual-motor job design: A type of job design that aims to ensure tasks match employees’ mental capacities, providing a healthy level of challenge without overwhelming them. This type of job design is frequently applied in roles involving decision-making and attention to detail, such as control room operators, air traffic controllers, and jobs in customer service, where maintaining focus and avoiding errors are essential.
Apply job design principles and embrace agile job design
Understanding and applying job design and agile job design principles is crucial for building a resilient and high-performing workforce. With these skills, HR professionals can create roles that are flexible, efficient, and aligned with the ever-changing needs of the business.
AIHR’s self-paced HR Manager Certificate Program equips you with the tools and knowledge to design jobs that support innovation, adaptability, and organizational success.
Job design strategies
Organizations apply four common job design strategies to increase a job’s motivational potential: job rotation, job enlargement, job enrichment, and job simplification. Each strategy impacts one or more of the elements in the MPS formula.
Let’s explore these strategies in more detail below.
1. Job rotation
Job rotation is the practice of moving employees between jobs in an organization. These moves will typically be lateral (at the same qualification or employment level) rather than promotional. Sometimes, a job rotation is temporary, and in other cases, some workers are on regular rotation and will move through several jobs in a year.
This increases skill variety and knowledge, allows employees to learn through different experiences and helps them gain a more thorough understanding of how different components of the business work together. It’s also an effective way for employees to find out where their greatest skills lie and what they most enjoy doing, which helps them develop their careers in the right direction.
For example, in an HR job rotation program, HR employees might spend a few months in different functions within the department, such as recruitment, compensation and benefits compensation, employee relations, and training and development. This rotation broadens their skills and provides insight into various HR operations. It helps prepare them for future leadership roles by offering a comprehensive understanding of the department’s functions.
2. Job enlargement
Job enlargement is a form of job redesign where managers and HR combine tasks of the same level and increase the scope of an existing role. For example, a graphic designer who was only handling the graphics for the company website and physical brochures was given the added task of handling the graphics for all social media content.
The aim of job enlargement is to increase productivity across the business, minimize repetitive tasks, and ensure team members remain motivated in their careers. This practice increases skill variety and task identity, enabling a worker to do more similar activities, which reduces monotony. It also teaches a variety of skills and provides a broader range of responsibilities, accountability, and autonomy. Effective job enlargement also leads to higher productivity levels and morale.

3. Job enrichment
Where job enlargement is aimed at adding tasks, job enrichment focuses on adding motivators to existing roles, increasing the Motivating Potential Score (MPS). Examples include adding opportunities to receive feedback, having more freedom to complete tasks in a way that suits the employee, and establishing client relationships to increase task significance. Another example would be creating natural work units, which are aimed at grouping interrelated tasks together to increase task identity.
Job enrichment gives employees new opportunities to learn and develop new skills and uncover their potential, which can increase their sense of accomplishment. This helps to boost motivation and morale at work, which can have a positive knock-on effect on the whole workplace and create a productive atmosphere. Job enrichment also creates additional performance-based opportunities for employees to be recognized and rewarded for their hard work.
4. Job simplification
Job simplification – the opposite of job enlargement – is the process of removing tasks from existing roles to make them more focused and maximize output. HR and managers may decide on job simplification if a role has been enlarged too much over time and become too much for one person to handle. The benefit of job simplification is that an employee becomes a specialist in their area, which increases their competence and confidence while minimizing error. Plus, employees become easier to replace as there is a smaller set of skills for someone else to learn.
For example, in a customer service department, agents initially manage all types of inquiries, but as the workload grows, job simplification divides these roles into specialized areas. One team handles billing, another manages account issues, and a third addresses technical support. This specialization boosts efficiency, reduces errors, and enhances employee expertise.
Job design examples
Let’s explore a range of examples of job design in real-life cases.
Example 1: WL Gore
WL Gore, a material science organization best known for the Gore-Tex material, has a non-hierarchical structure where there are no job ranks, titles, or set descriptions. Each person commits to contribute their unique skills individually and collectively to different tasks and areas of work. Workers are hired based on how strong of a cultural fit they are with the company.
Once an employee has completed their core responsibilities, they are free to build on their role as they please, based on their specific interests and career aspirations. This allows employees to take ownership of their own development and use their own judgment at work.
When an employee quits, instead of automatically replacing them, the role is reevaluated to determine if it’s still relevant. This ensures constant job design and redesign.
Example #2: Centrica
In 2005, a UK-based international energy company, Centrica, went from five London sites to three and dramatically changed its ways of working. Hot Desking and a clear desk policy were implemented, breakout areas and additional meeting rooms were introduced for conversations, IT upgrades meant that employees could collaborate and share documents online, and flexible working policies allowed employees to choose the location they worked at to best perform their duties.
To prepare for this change, managers were provided with training and encouraged to model the changes for their team. Employees were also helped to prepare for the changes with roadshows, coaching, team-building sessions, one-to-one meetings, and technical training. These changes led to a 38% increase in improved work-life balance and a 4% increase in engagement.
Example #3: Unipart
A supply chain company, Unipart prioritizes continuous improvement when it comes to job design, and decision-making is delegated to the lowest level. Employees determine the best way of working for themselves, then design, measure, implement, and continuously improve it—for themselves and their customers. This means that while tasks are simplified, employees have more responsibility and control over what they do, and work processes and performance are constantly improved across the business.
Unipart’s Coventry site had to reconfigure its operations and workforce to provide different services, implement technology, and adapt to more complex customer needs. Value stream mapping—used by the workers who would be affected by these changes—identified all of the processes involved in the work and helped to redesign them to reduce waste. With the rest of their team, they decided on the optimum design of processes as well as the physical design of the workspace, then took responsibility for implementing and managing the improvements.
Following these changes, service levels dramatically improved.
Job design process: How to get started
Here are some simple steps for HR professionals to get started with job design at your organization.
- Apply the Job Characteristics Model: Ensure that each job contains the five core characteristics to challenge and motivate your workers: skill variety, task identity, task significance, autonomy, and feedback.
- Identify key responsibilities, skills & competencies: Work with managers to identify what’s most important in each job. Once you know the main requirements of a role or the most important objectives and tasks, you can then strip away anything unnecessary and ensure employees have the support and resources they need to perform and grow in their careers.
- Utilize the free Job Design Optimization Tool (JDOT): With this tool, you can assess the demands of any job and the resources within the organization to fulfill that job, determine when a job is effectively or poorly designed, and see the design changes you can make to improve the functioning of a job.
- Think about what makes work fulfilling: Aside from compensation and benefits, other factors such as being recognized and rewarded for achievements, having a supportive manager, access to training and development opportunities, tasks that utilize your talents and skills, having a clear path for growth, and seeing how your work benefits others and helps the organization thrive can all help workers feel fulfilled in their job. Think about this in the job design process.
- Keep flexibility in mind as job design might need to evolve: We live in an interesting time where technology is rapidly changing the way we work. Certain jobs are becoming obsolete, others are transforming, and new ones are created every day.
- Create room for job crafting: Job crafting refers to employees having the freedom and taking the initiative to shape the characteristics of their job, either independently or in collaboration with their manager. Job crafting can be encouraged through higher organizational support, higher levels of autonomy, and higher self-efficacy, which is the employee’s belief in their capacity to achieve what they want to achieve. Job crafting leads, in turn, to higher levels of job satisfaction.
To sum up
Job design is a systematic approach to creating jobs that are sustainable, motivating, and contribute to wider organizational goals. When done well, job design not only supports the professional growth and motivation of individual employees but also drives organizational performance and success, creating a positive feedback loop that benefits everyone involved.
FAQ
Job design is the process of creating a job that helps a business achieve its goals while challenging, motivating, and rewarding the employee.
Job design is important because the world of work and your business are constantly changing. Each job needs to be regularly refreshed to ensure that it aligns with organizational goals and is manageable for the employee.
Effective job design leads to higher productivity, quality of work, job satisfaction, motivation, and engagement, as well as lower absence and lower employee turnover intentions.
The four common types of job design are job rotation, job enlargement, job enrichment, and job simplification.
An example of job design could be a Project Coordinator for Renewable Energy Initiatives. This role involves managing project timelines, ensuring regulatory compliance, and facilitating team communication. Key skills include project management, organization, and prior industry experience. The employee will have the autonomy to identify risks, propose solutions, and enhance workflow processes. They will coordinate meetings, prepare reports, and collaborate across teams to meet sustainability goals, balancing clear responsibilities with opportunities for innovation and growth.
This job design balances well-defined responsibilities with the freedom to propose and implement improvements, making it motivating for the employee while supporting the company’s larger strategic goals.
The post Job Design: A Practitioner’s Guide [2025 Edition] appeared first on AIHR.
]]>